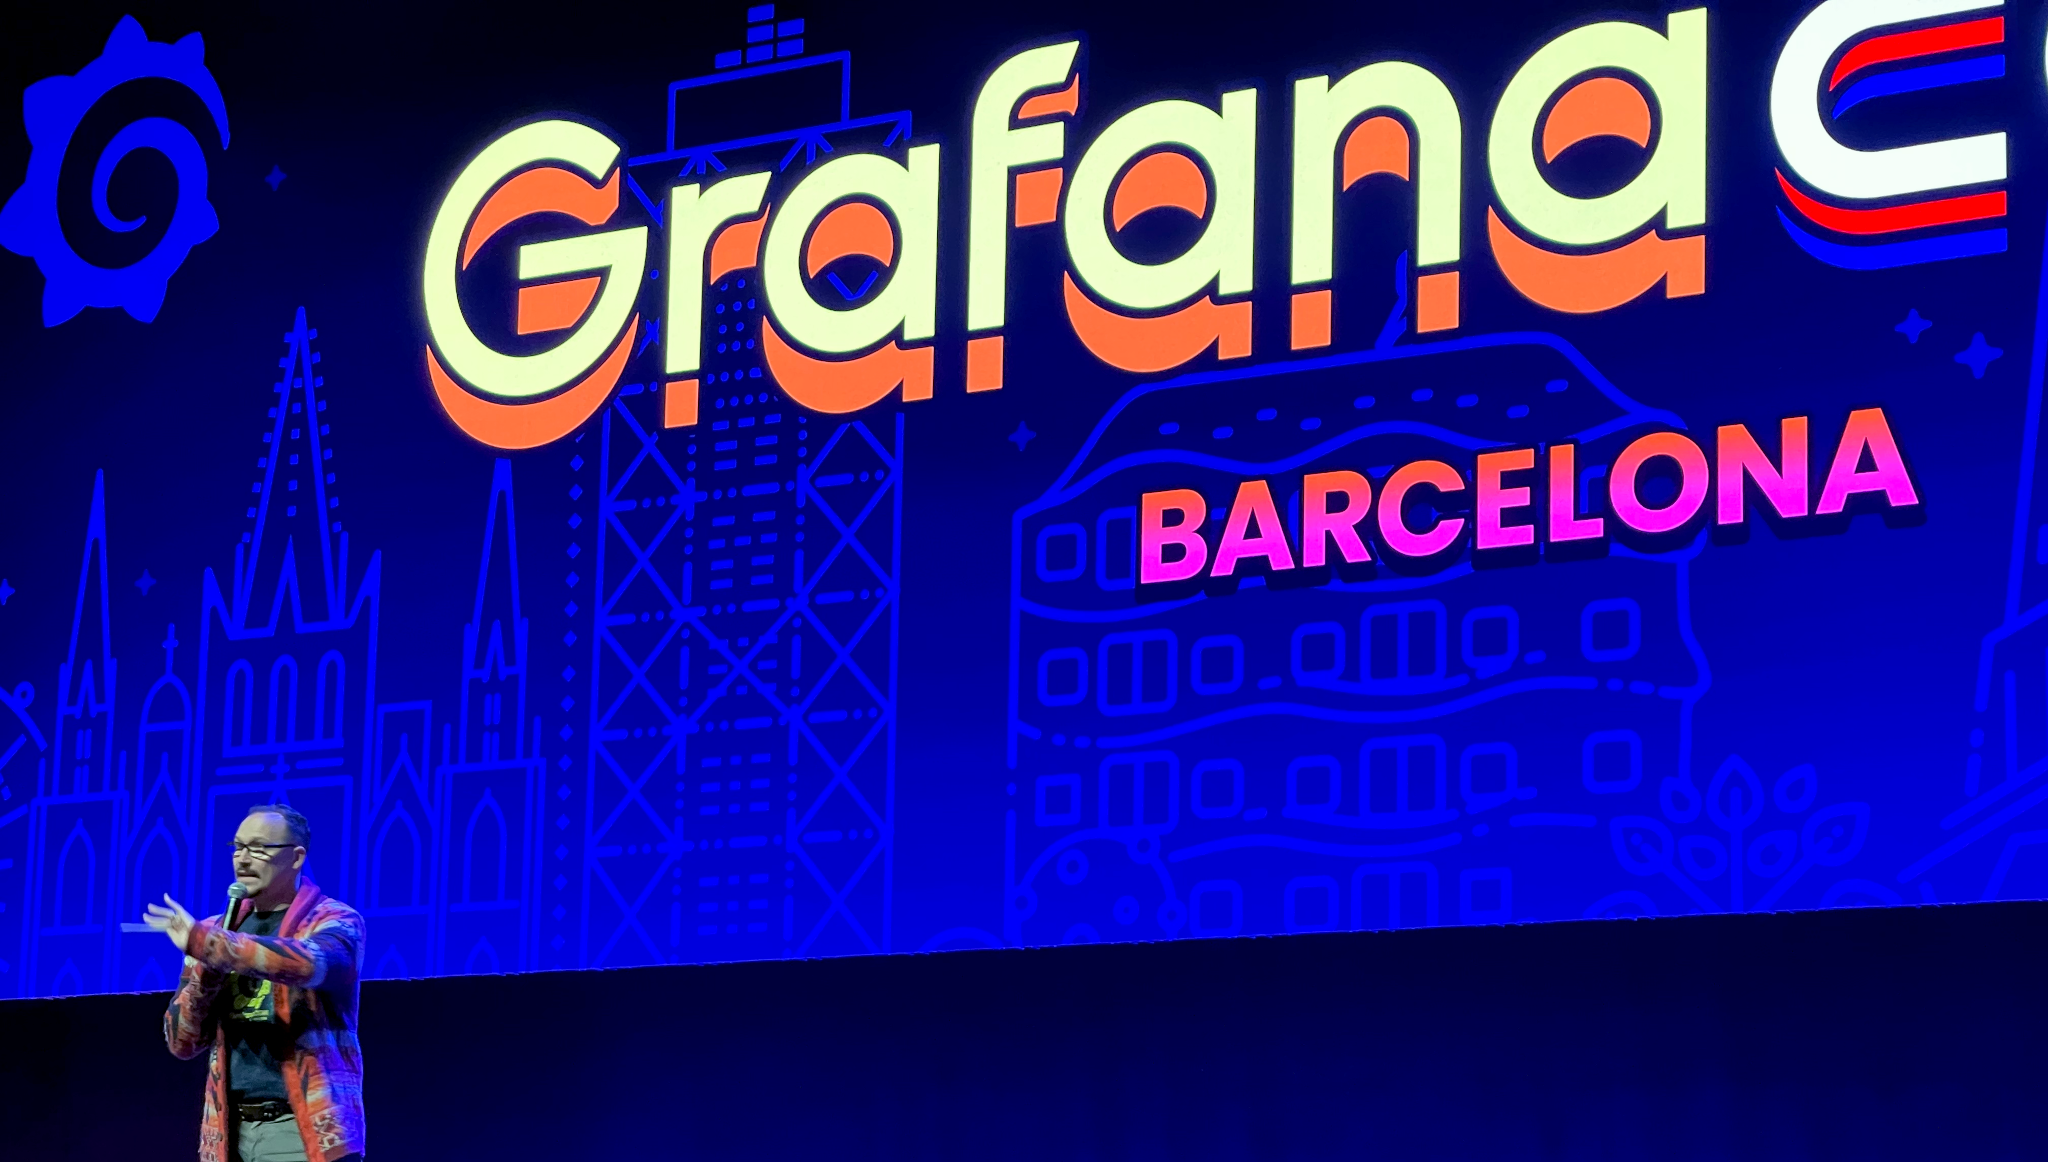
I recently attended my first GrafanaCon, held in Barcelona, Spain, from 20-22 April.
I hated it.
TL;DR; There was a lot to hate about this conference. It was incredibly well organized, which made me feel bad about the past events in which I’ve been involved. On the second day I didn’t get my choice of meal, and they never had enough diet soda on hand. The venue was excellent, and the single track nature of the presentations meant I was exposed to amazing speakers with no other options. The worst part is that it made me want to give up my weekends to play with the new version of Grafana. The nerve.
Grafana was started in 2014, and the earliest references I can find to our involvement with it at OpenNMS are from the latter half of 2015. I know we were really excited about it as a visualization tool, especially since we were working on a new time series data storage library called Newts and we needed a way to display the collected values.
OpenNMS was also one of the first third-party data sources created for Grafana, and Jesse White spoke about it at the first GrafanaCon. We had limited budget so Jesse or someone on his team ended up representing us at most of the Grafana events, and it took until now for me to attend one.
It was, truly, a very good conference. When I was verifying the venue location I noticed that it was also sold out, with over 650 people in attendance.
The conference spanned three days. Monday consisted of workshops, with the main conference running Tuesday through Wednesday. The agenda was packed, with keynotes starting at 09:00 and running until 18:00 both days. That said, there were plenty of breaks to enable the hallway track, and the Tuesday evening event (hosted by AWS) allowed even more time for folks to interact.
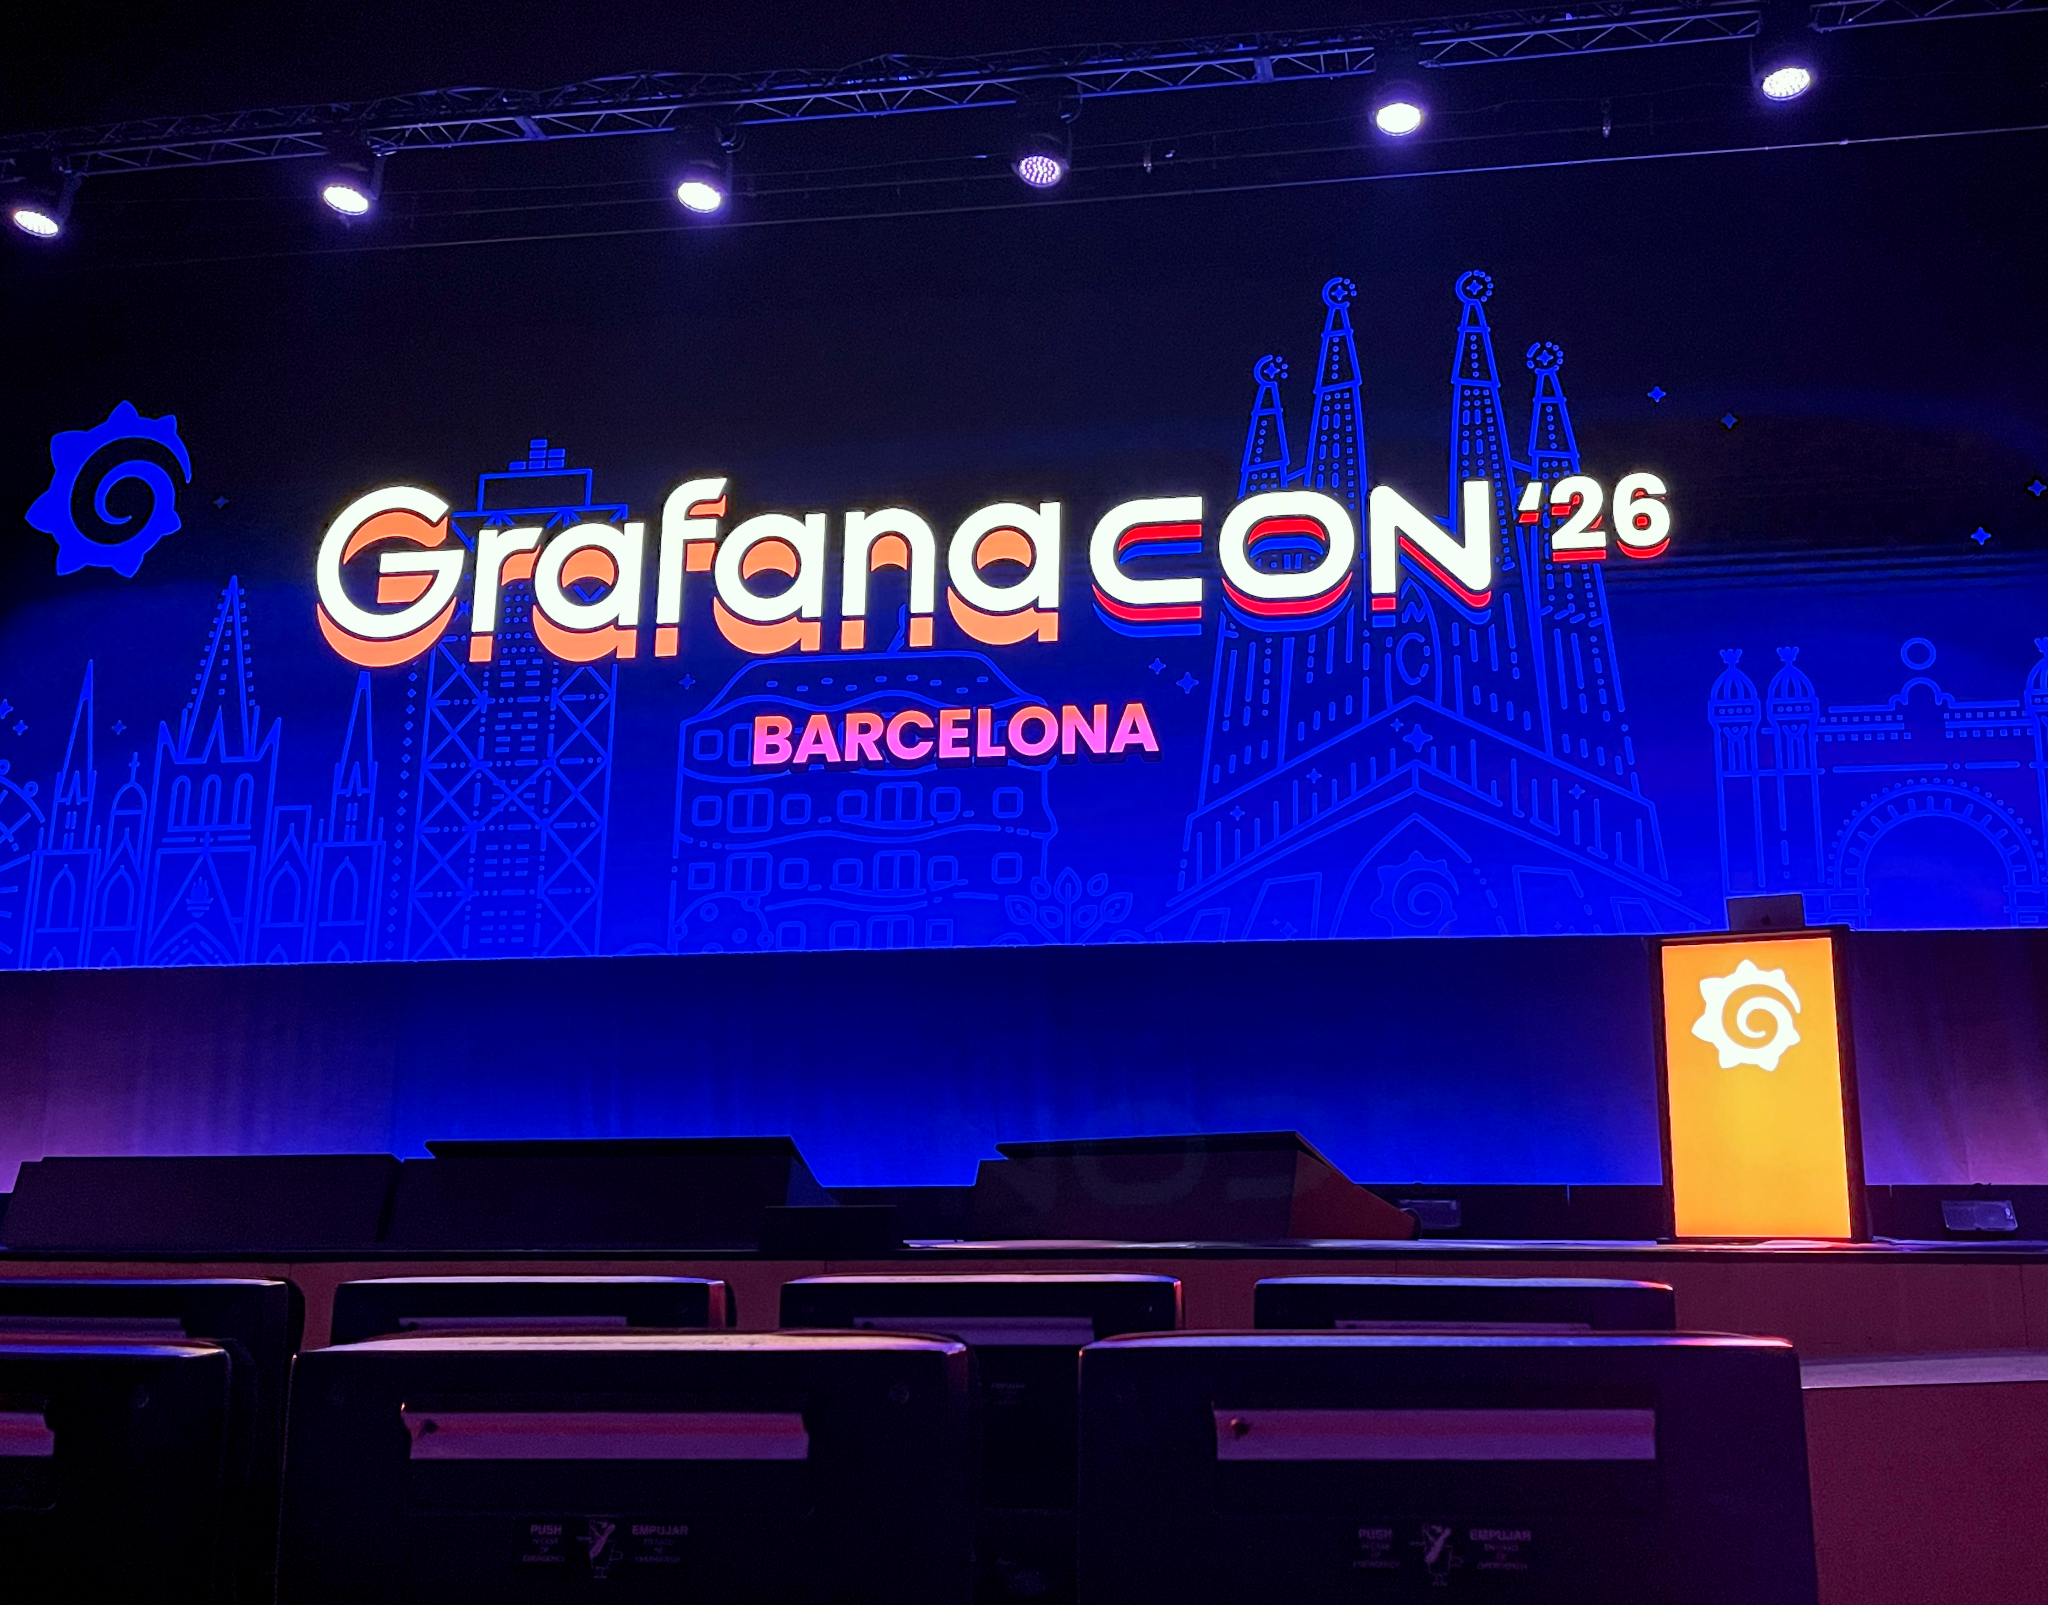
The venue was Palau de Congressos de Catalunya, which is several miles from the Barcelona city center, next to the Universitat Politècnica de Catalunya. Barcelona is my favorite city on the planet, but it can get crowded with tourists. This location was convenient and near a lot of nice restaurants while avoiding the crowds.
The most of the activity took place on the main floor, which featured a large area containing the exhibit hall as well as the main auditorium. The stage itself was huge, but the AV setup meant that everyone had a good view. I don’t remember any major issue with the technical side of the sessions and the conference WiFi was actually pretty good as well. The lower level had a large room for breakout sessions and was where lunch was served.
I did not attend the optional workshops on Monday, but I did use the time to get my badge and meet up with some folks.
In my role at AWS I work with a lot of the partner managers for customers, and my main contact at Grafana is Will Nunes. He was working the badge desk and it was nice to finally meet him face to face, and he would end up taking care of me for the time I was there.
The main event started on Tuesday. I arrived around 08:30 to find a very nice spread of food and drinks (coffee, juice, water) laid out for folks, and this would be a theme throughout the two days. You really won’t go hungry at a GrafanaCon.
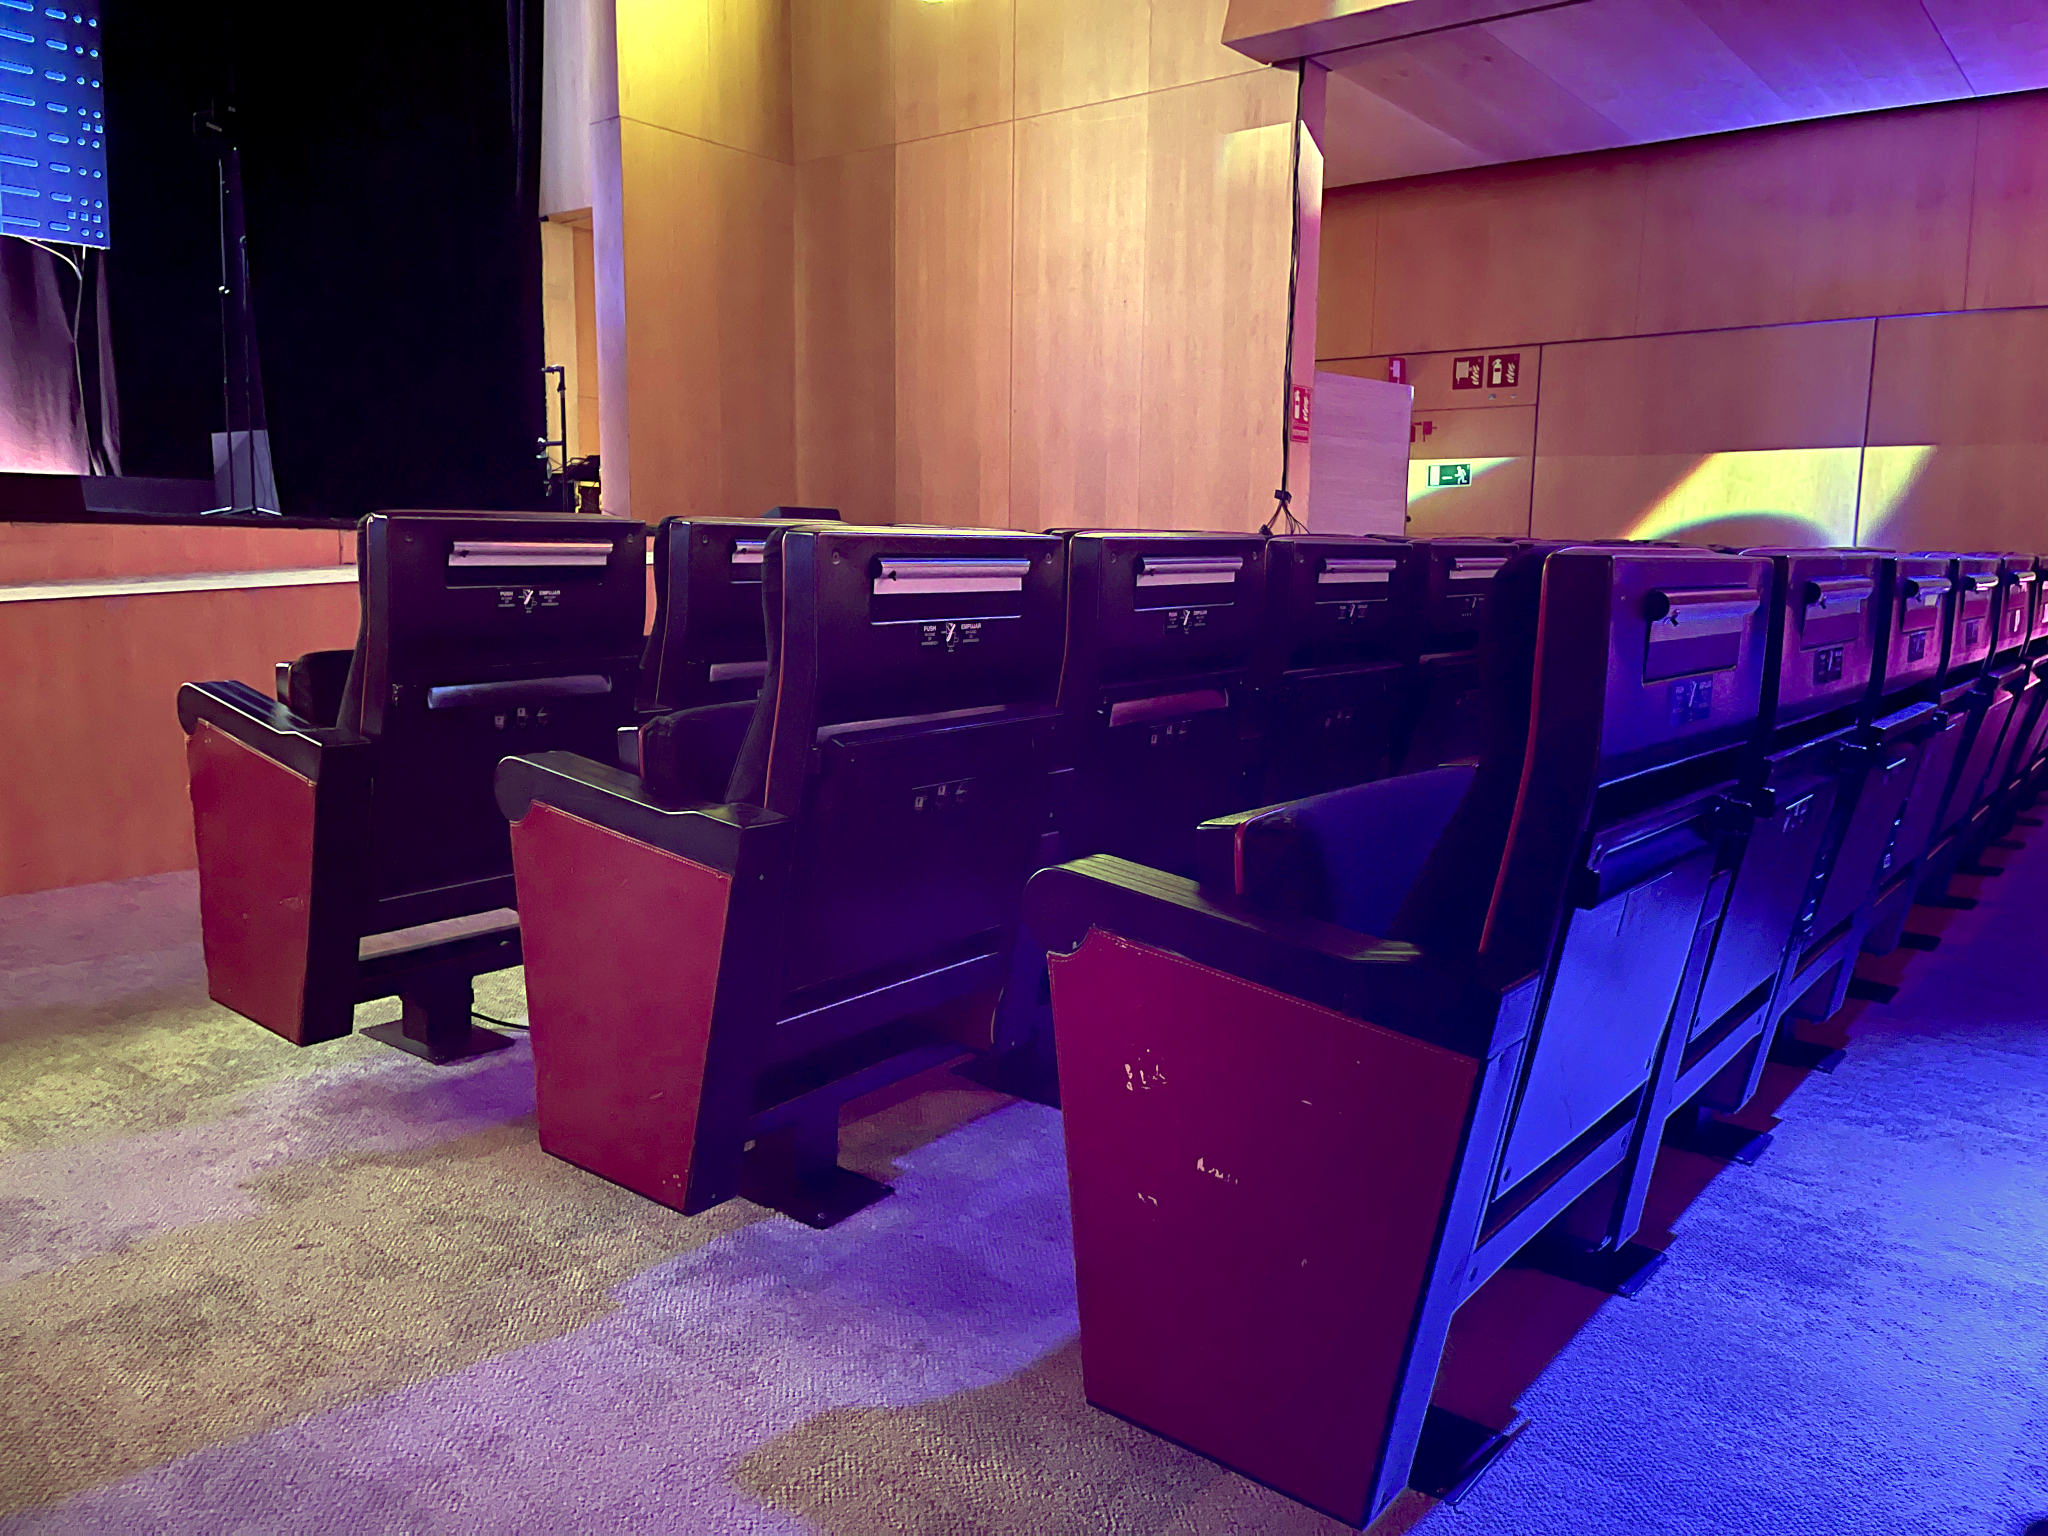
Since I knew I was going to write this (long) post, I got a seat early, up near the stage. The auditorium had the best seats in my memory - super comfortable with large pull out tables, perfect for laptops and with access to power built-in to the seat backs.
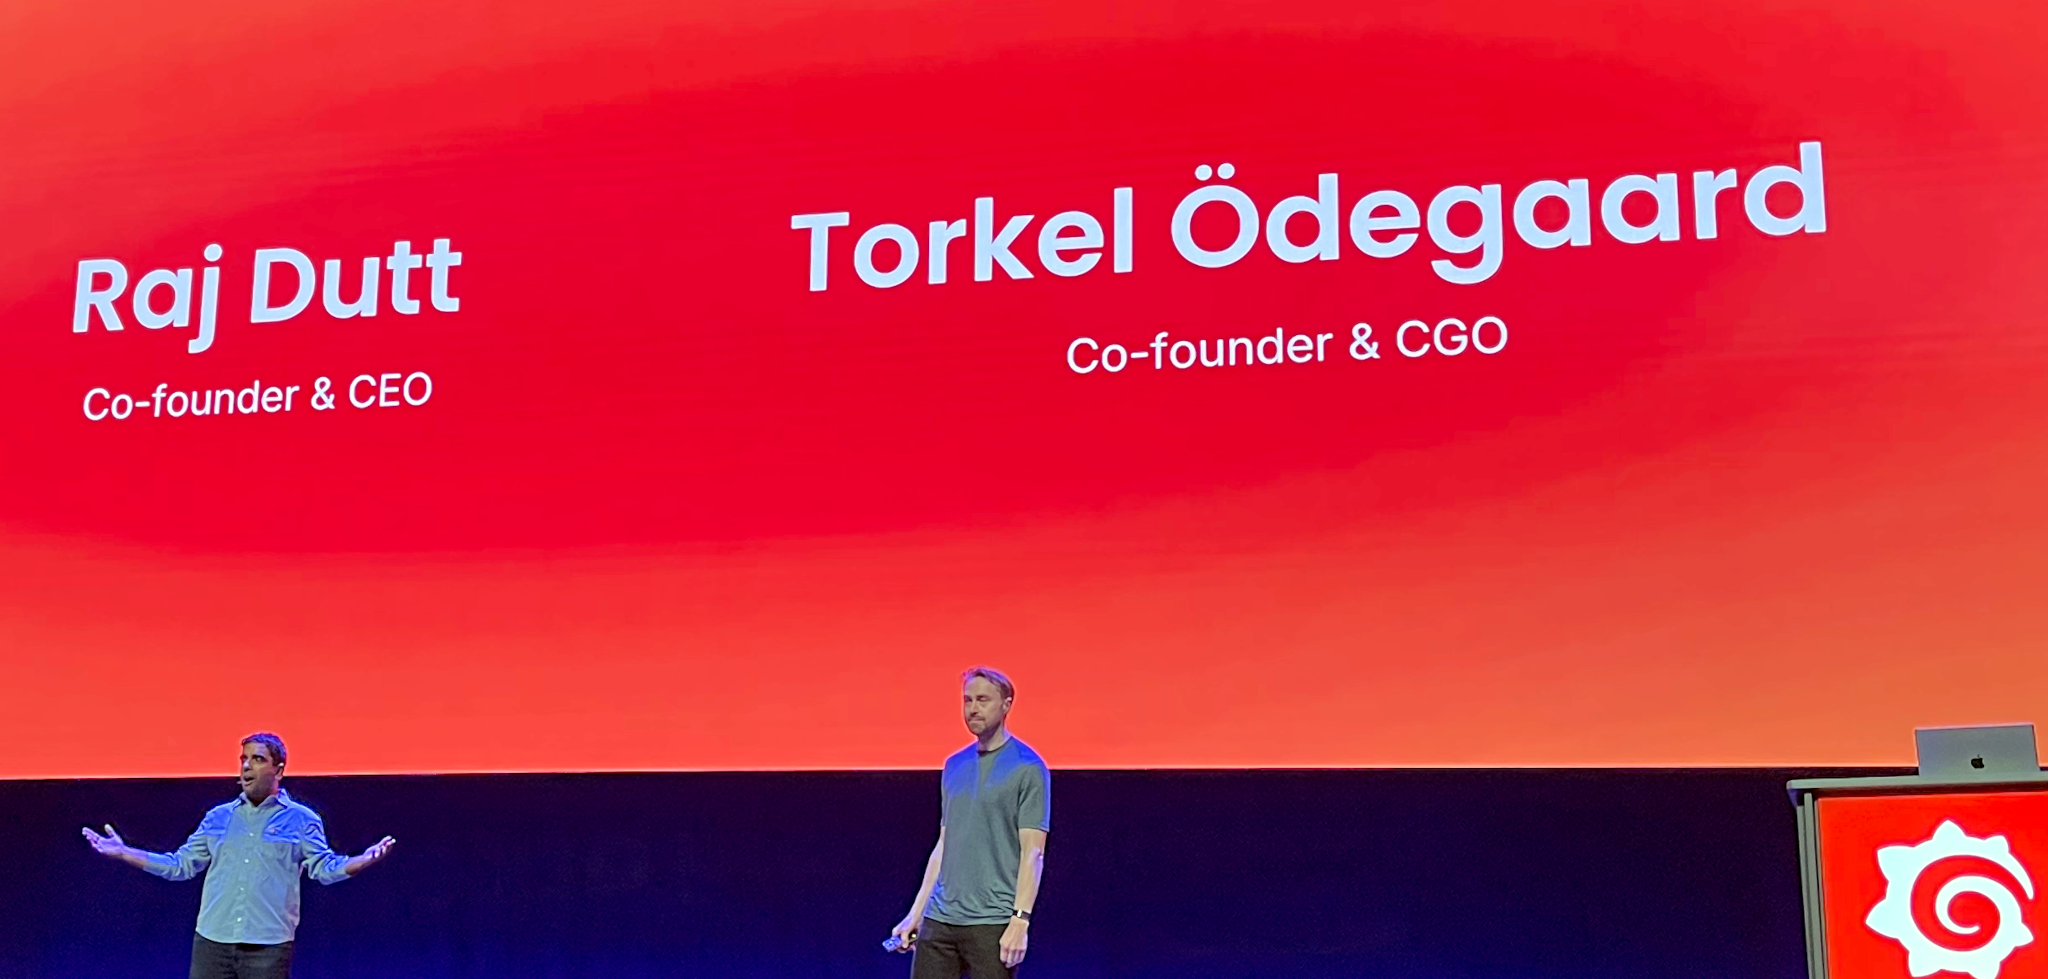
The opening keynote featured Raj Dutt and Torkel Ödegaard. To use an Apple analogy, Raj is Steve Jobs to Torkel’s Woz. They showed a cool little video featuring Grot (the GRafana robOT) in Barcelona. I usually have a visceral, negative reaction to GenAI videos, but they used actual footage of Barcelona and just used AI to superimpose Grot on the screen. It was really cool when they showed pictures of Park Güell and Grot became mosiac-tile Grot.
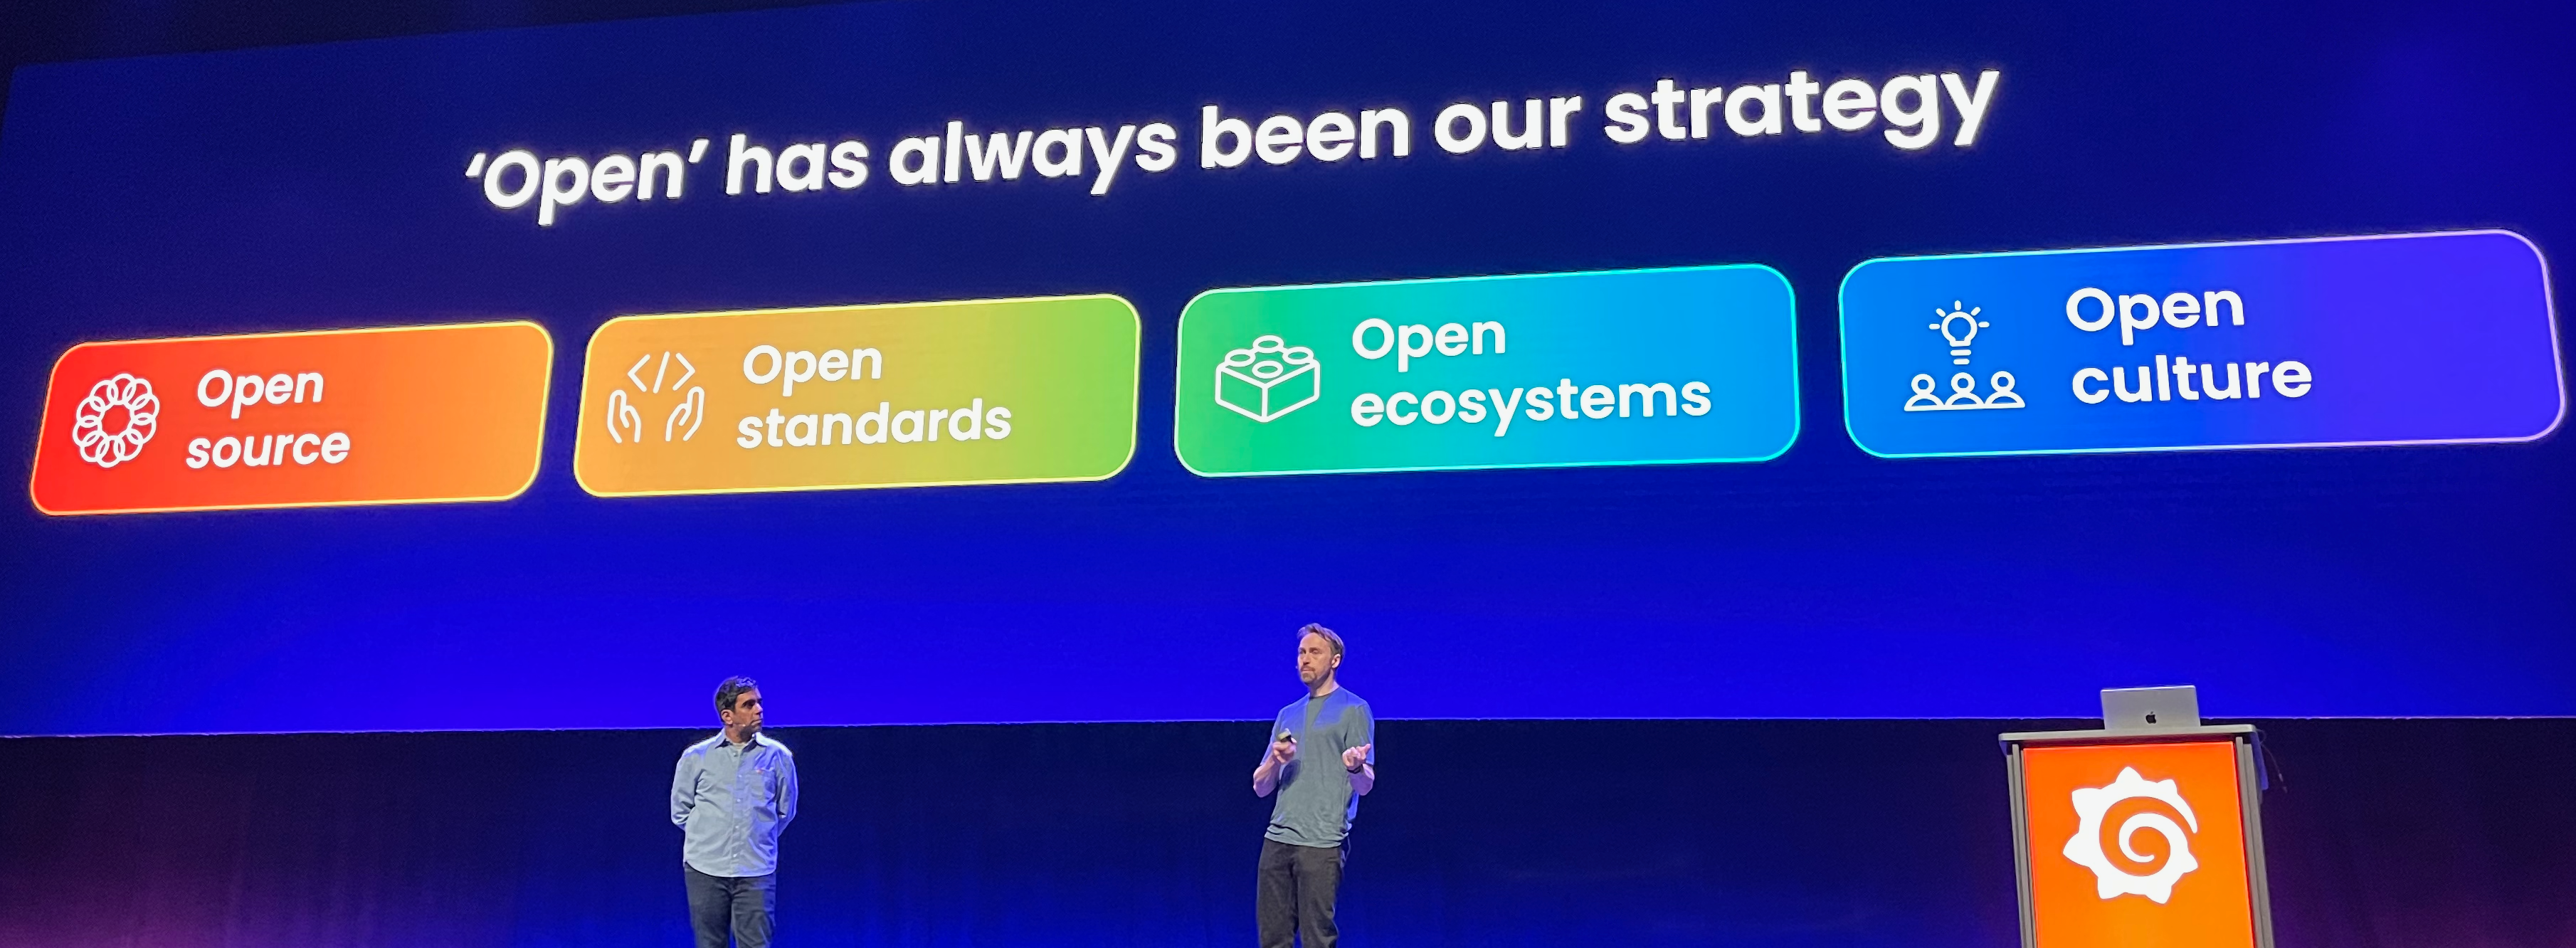
After the video they showed a slide that really incapsulated the Grafana message: openness. It has been the key to their success.
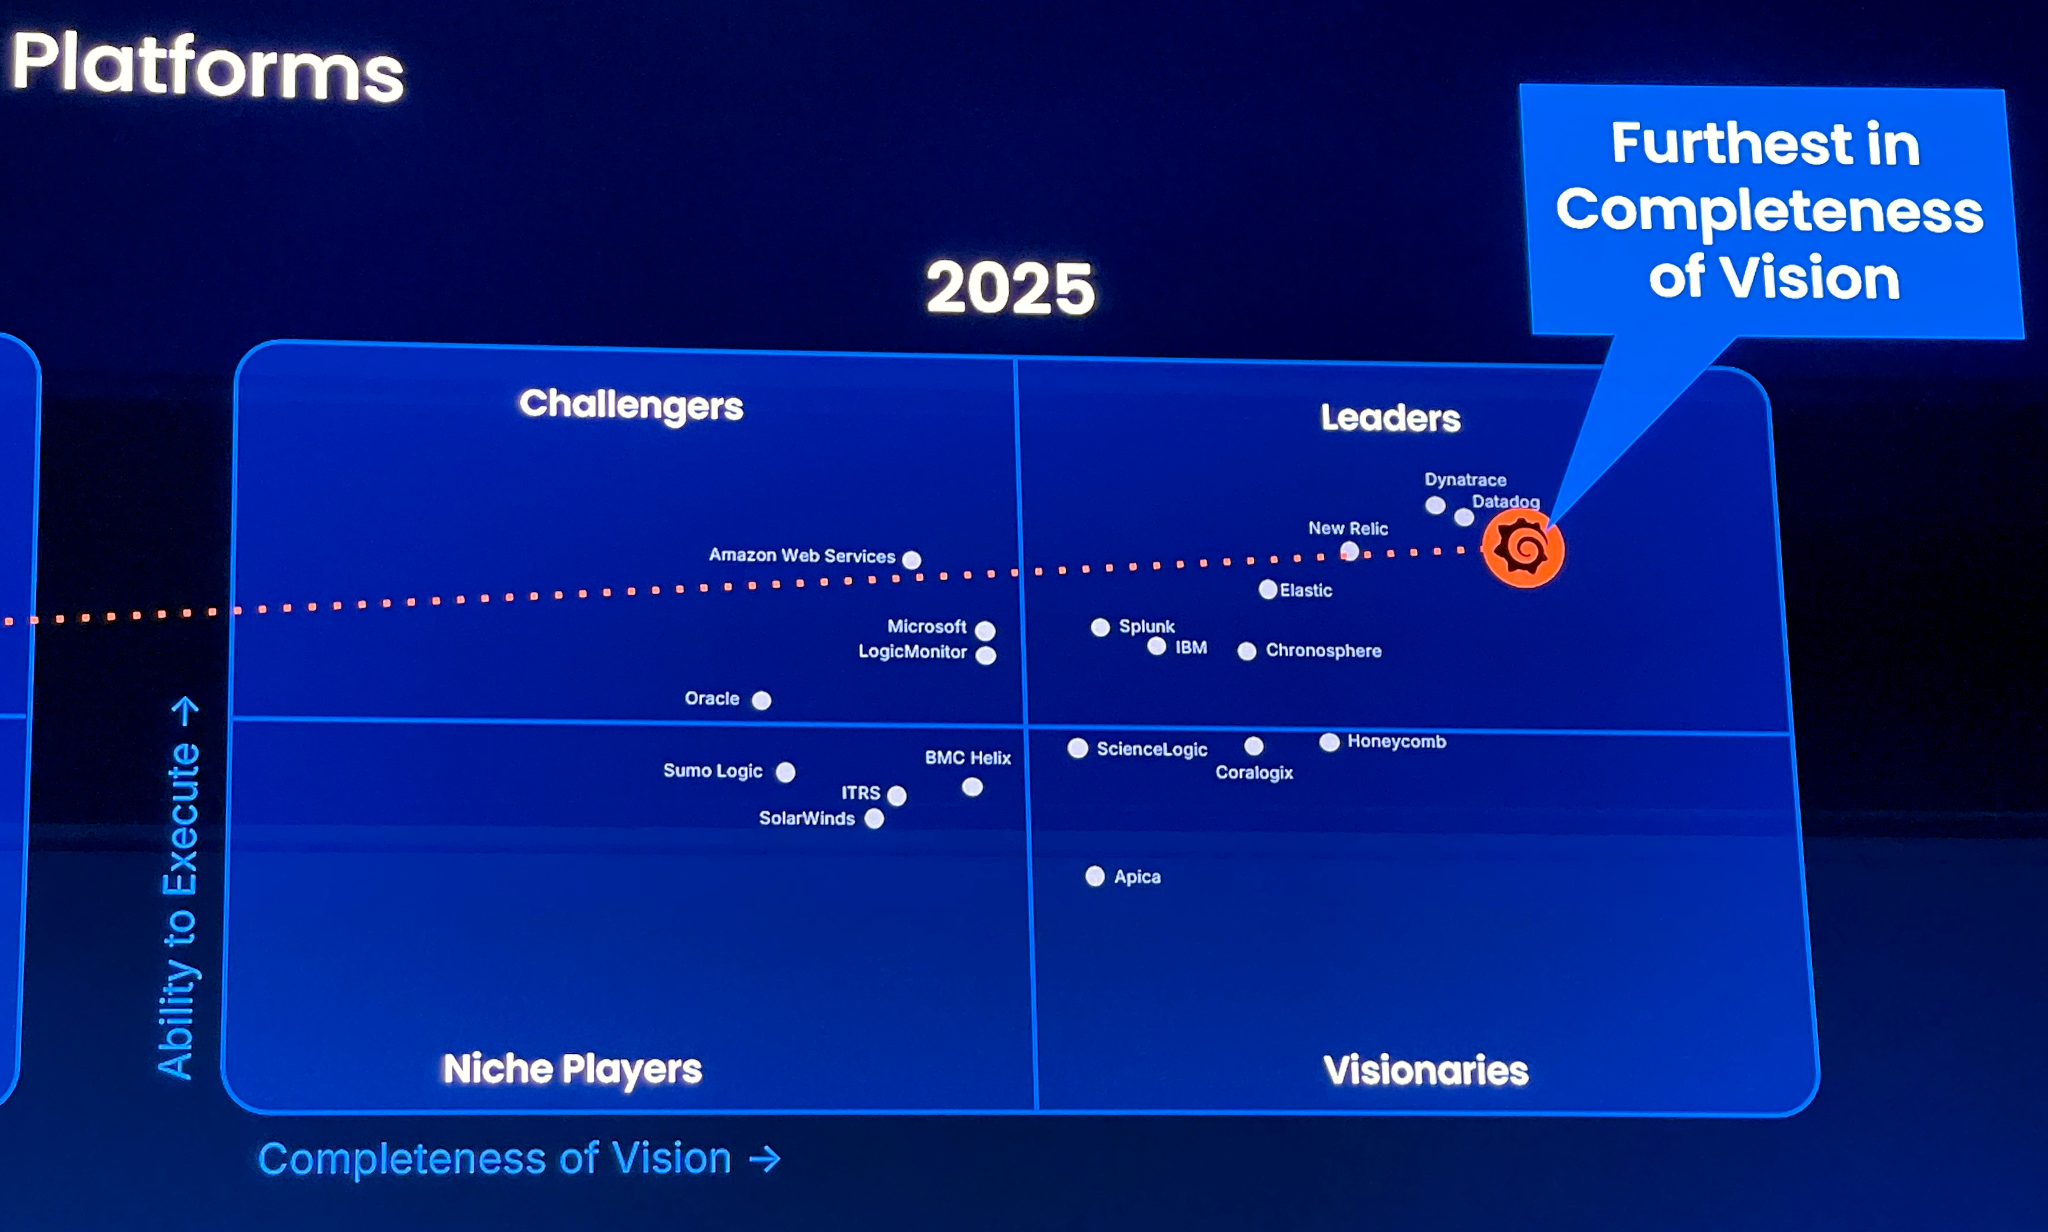
They also showed a cool progression of the movement of Grafana across the Gartner “magic quadrant” for observability platforms. Over the past three years there has been a steady progression as Grafana has started to challenge established players, ending with 2025 where they had the strongest “completeness of vision” of the sample.
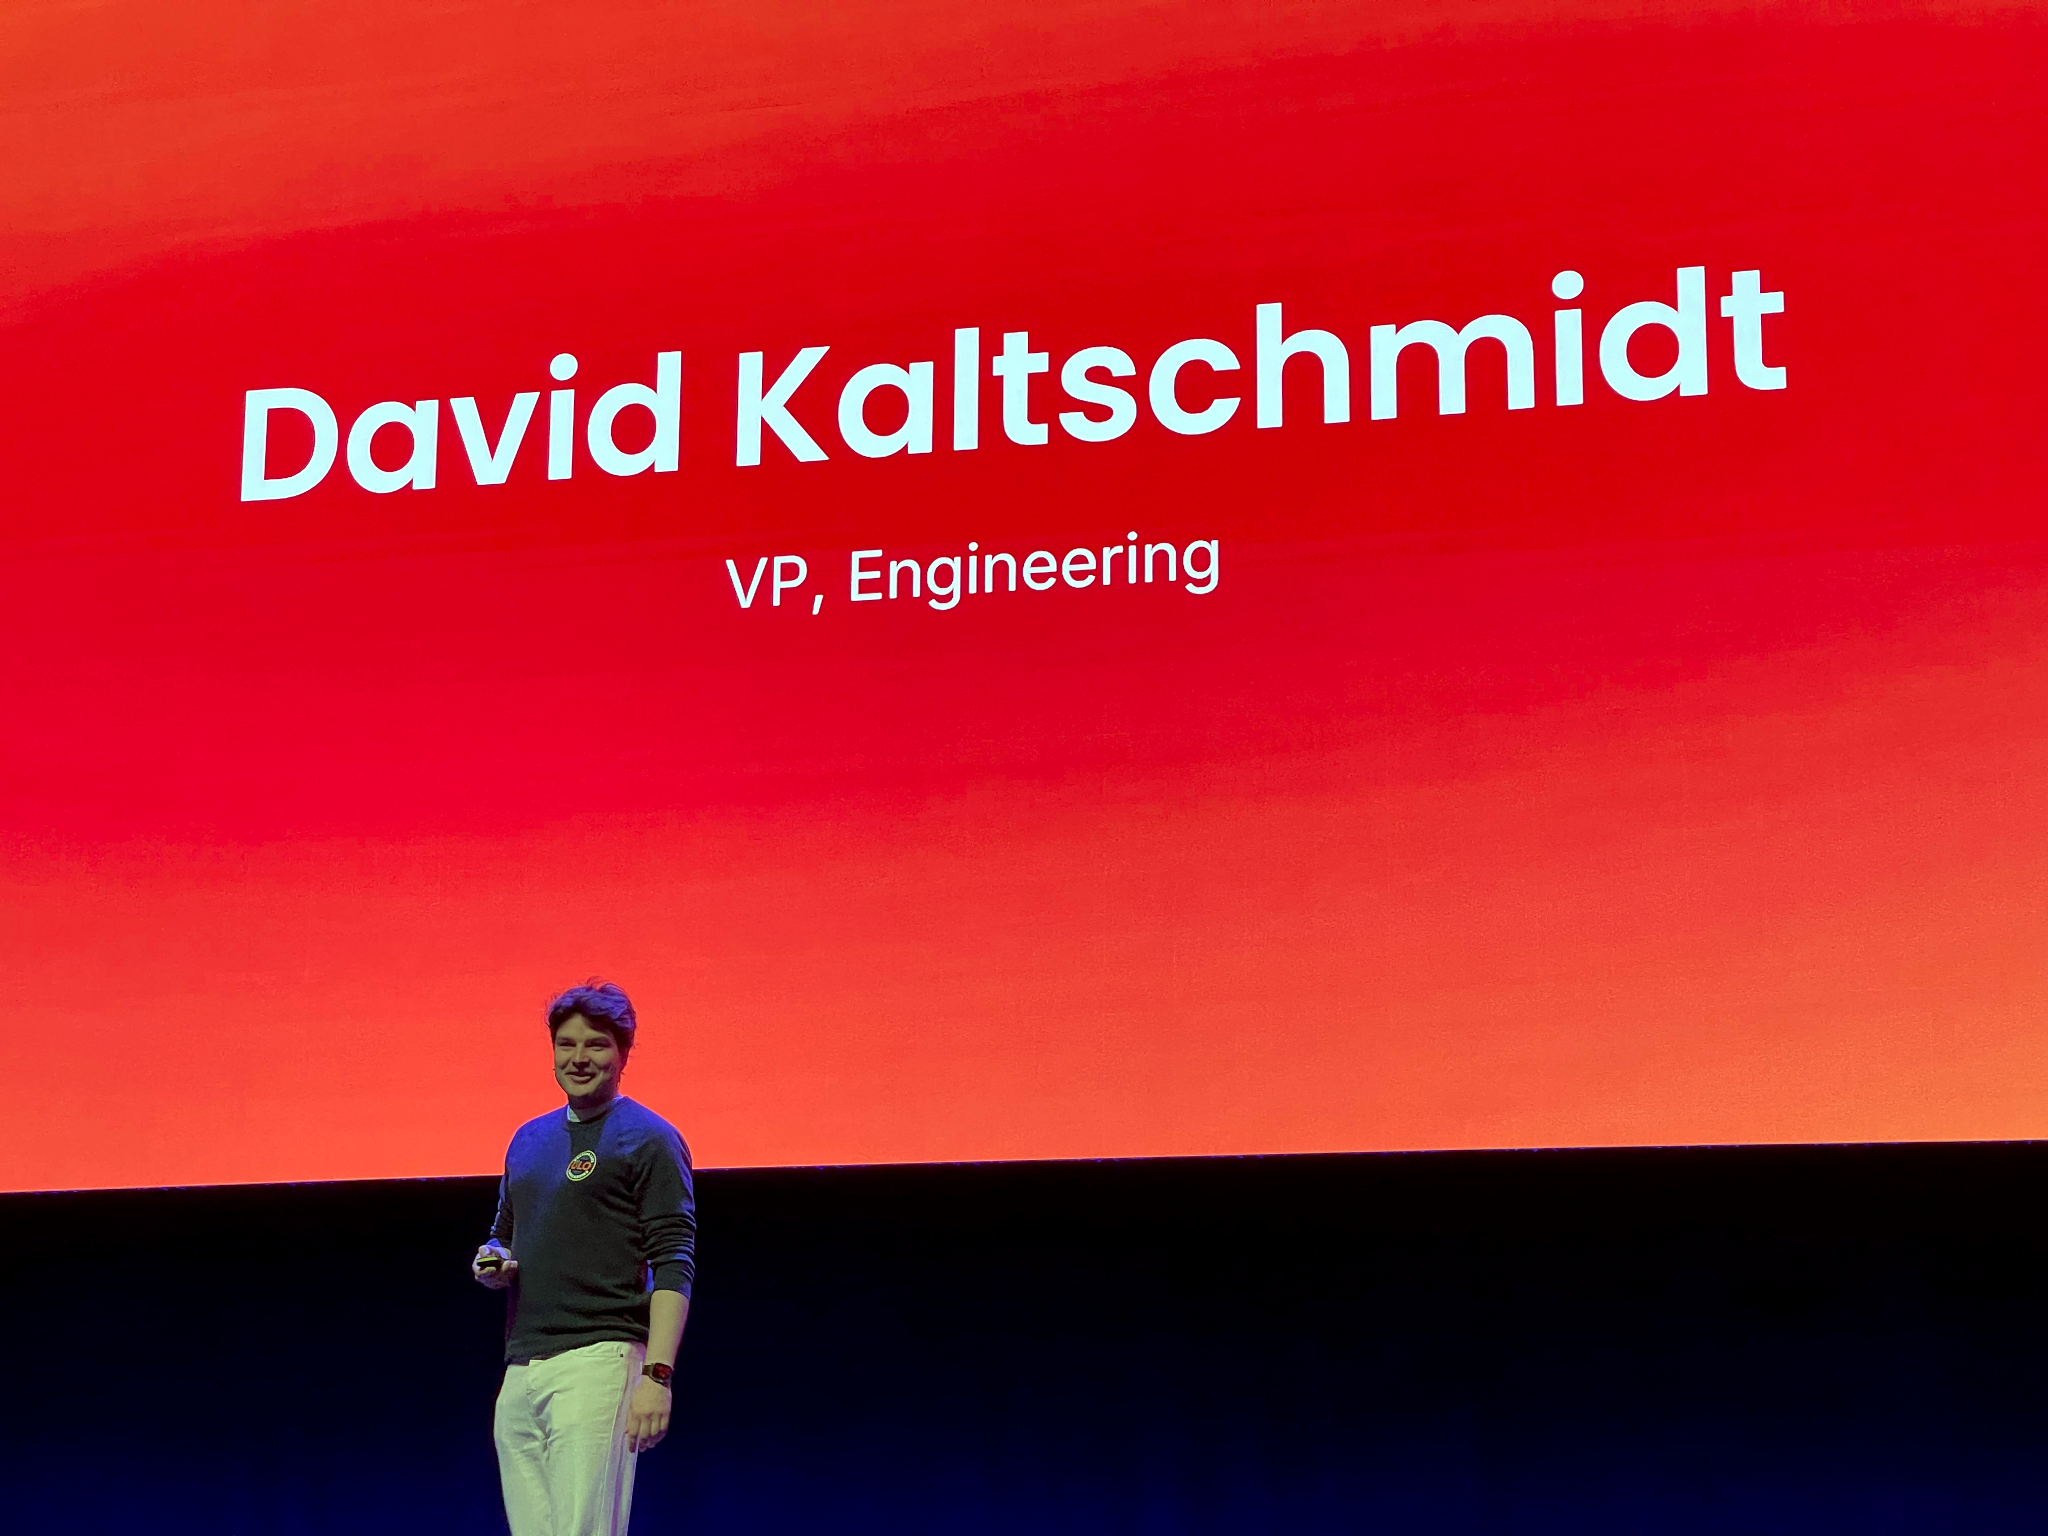
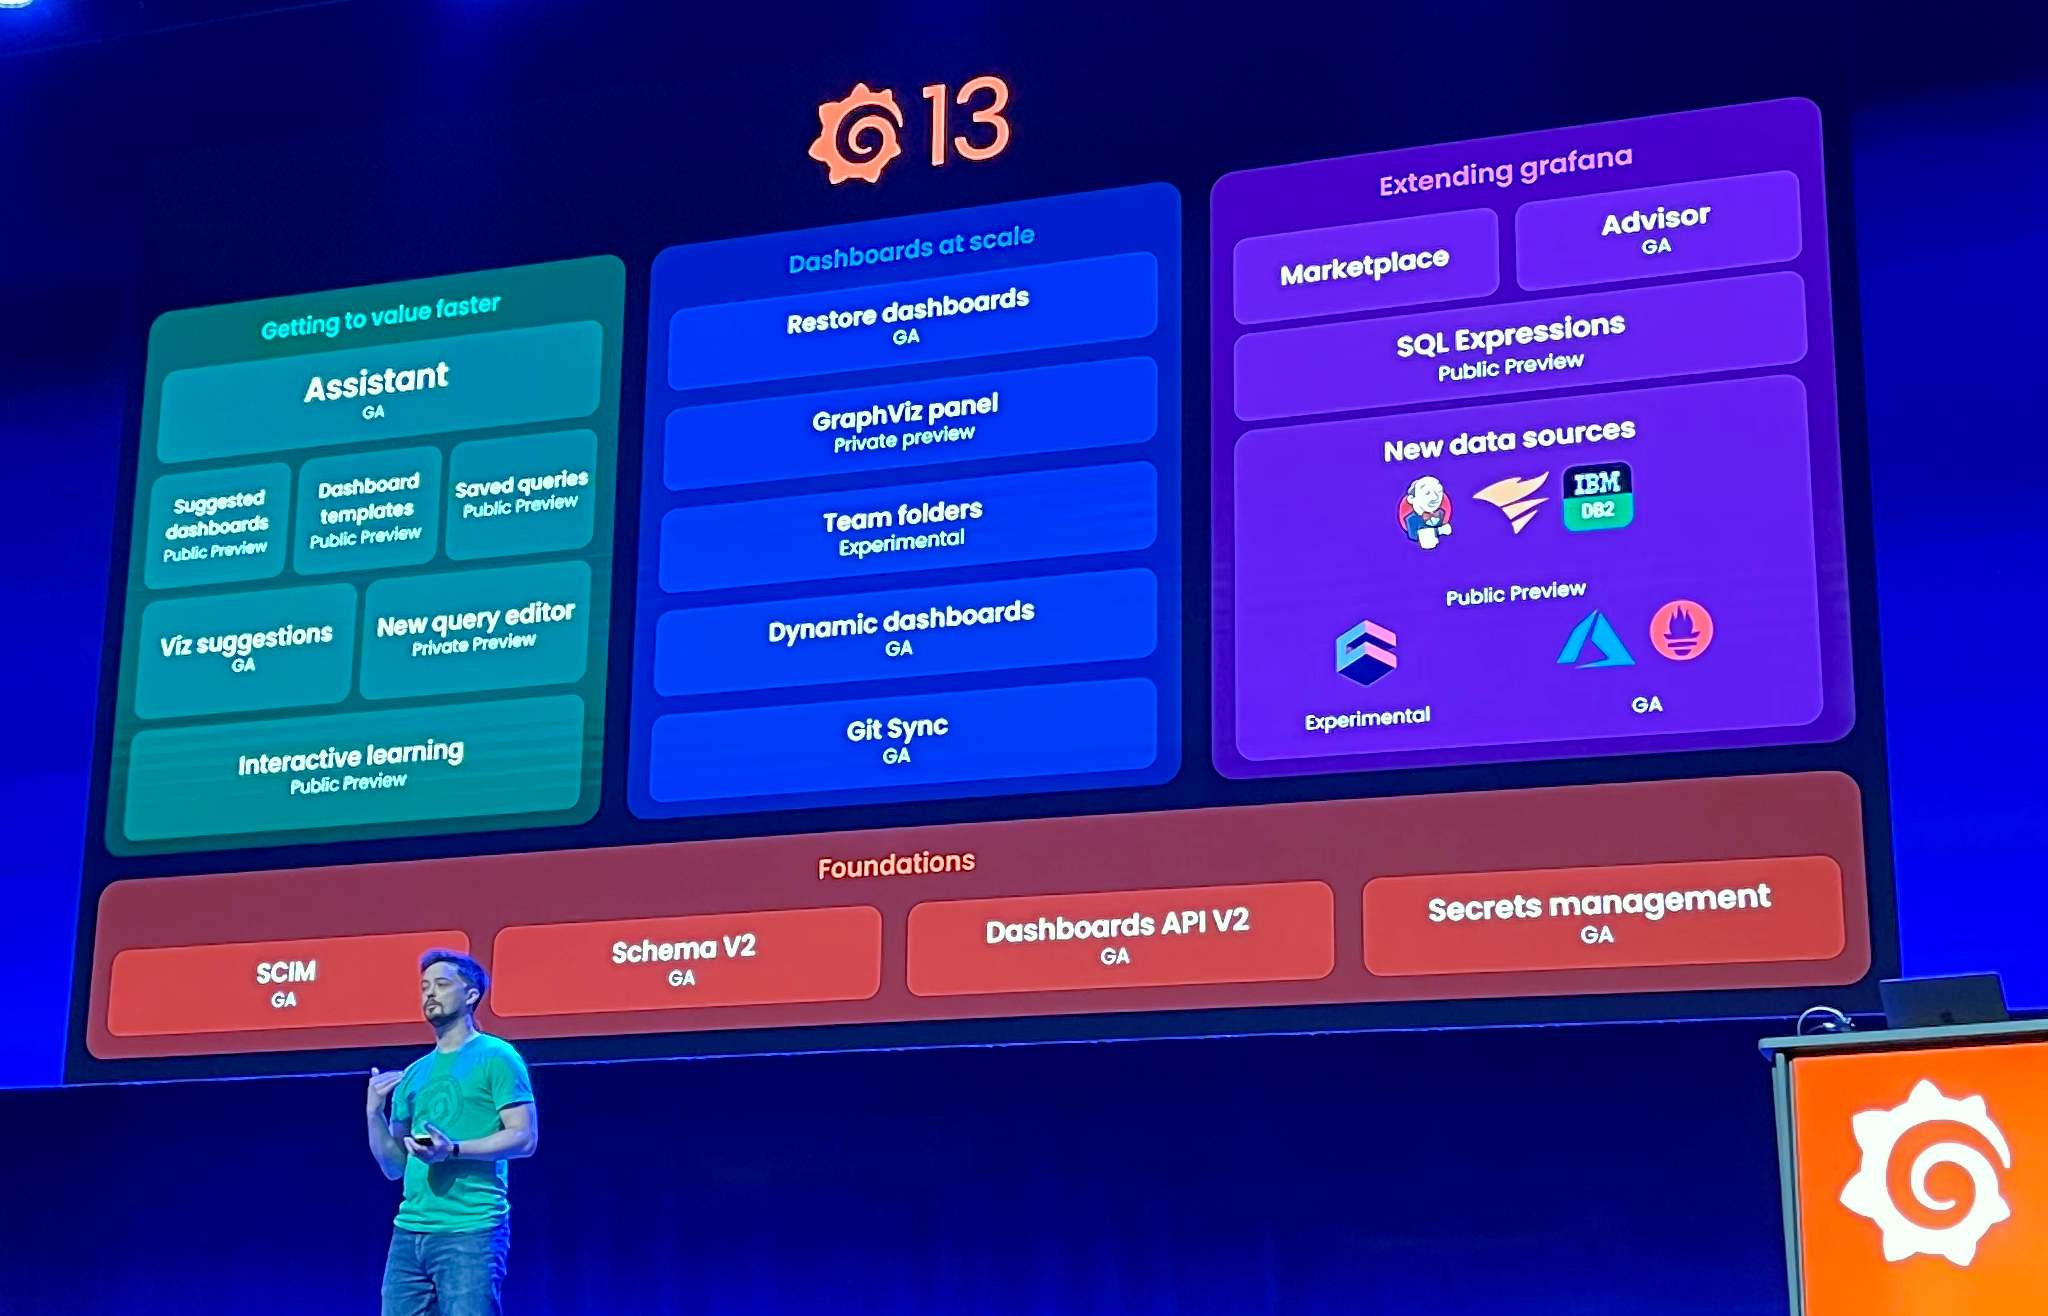
The next speaker was David Kaltschmidt, VP of Engineering. He introduced Grafana 13. We would get a deep-dive into the newest version on Wednesday, but he covered the three main areas of improvement: make it easier to get started, make it scale, and make it available everywhere.
Poyzan Taneli then spoke on Loki, an open source logging platform maintained by Grafana. The main improvement here was an integration with Apache Kafka. Kafka is a messaging bus with very high performance. We used it with OpenNMS and what was cool is that it was very easy to publish data and then just subscribe to those streams of interest. The new changes will allow Loki to scale more and perform better in those situations that require it.
The next speaker was Ted Young, who co-founded OpenTelemetry.
OpenTelemetry is a CNCF project that provides a framework for telemetry data, such as traces, metrics and logs. It is designed to provide a common API for the instrumentation of applications and infrastructure. It came along about the same time I was leaving OpenNMS and stepping away from observability, but I have been casually following the project since it was announced. I love the fact that this provides a common way for observability platforms to consume telemetry data without relying on a proprietary format or vendor.
Young’s presentation was focused mainly on stability, and while it is not exactly sexy, the goal is to make OTel stable by default.
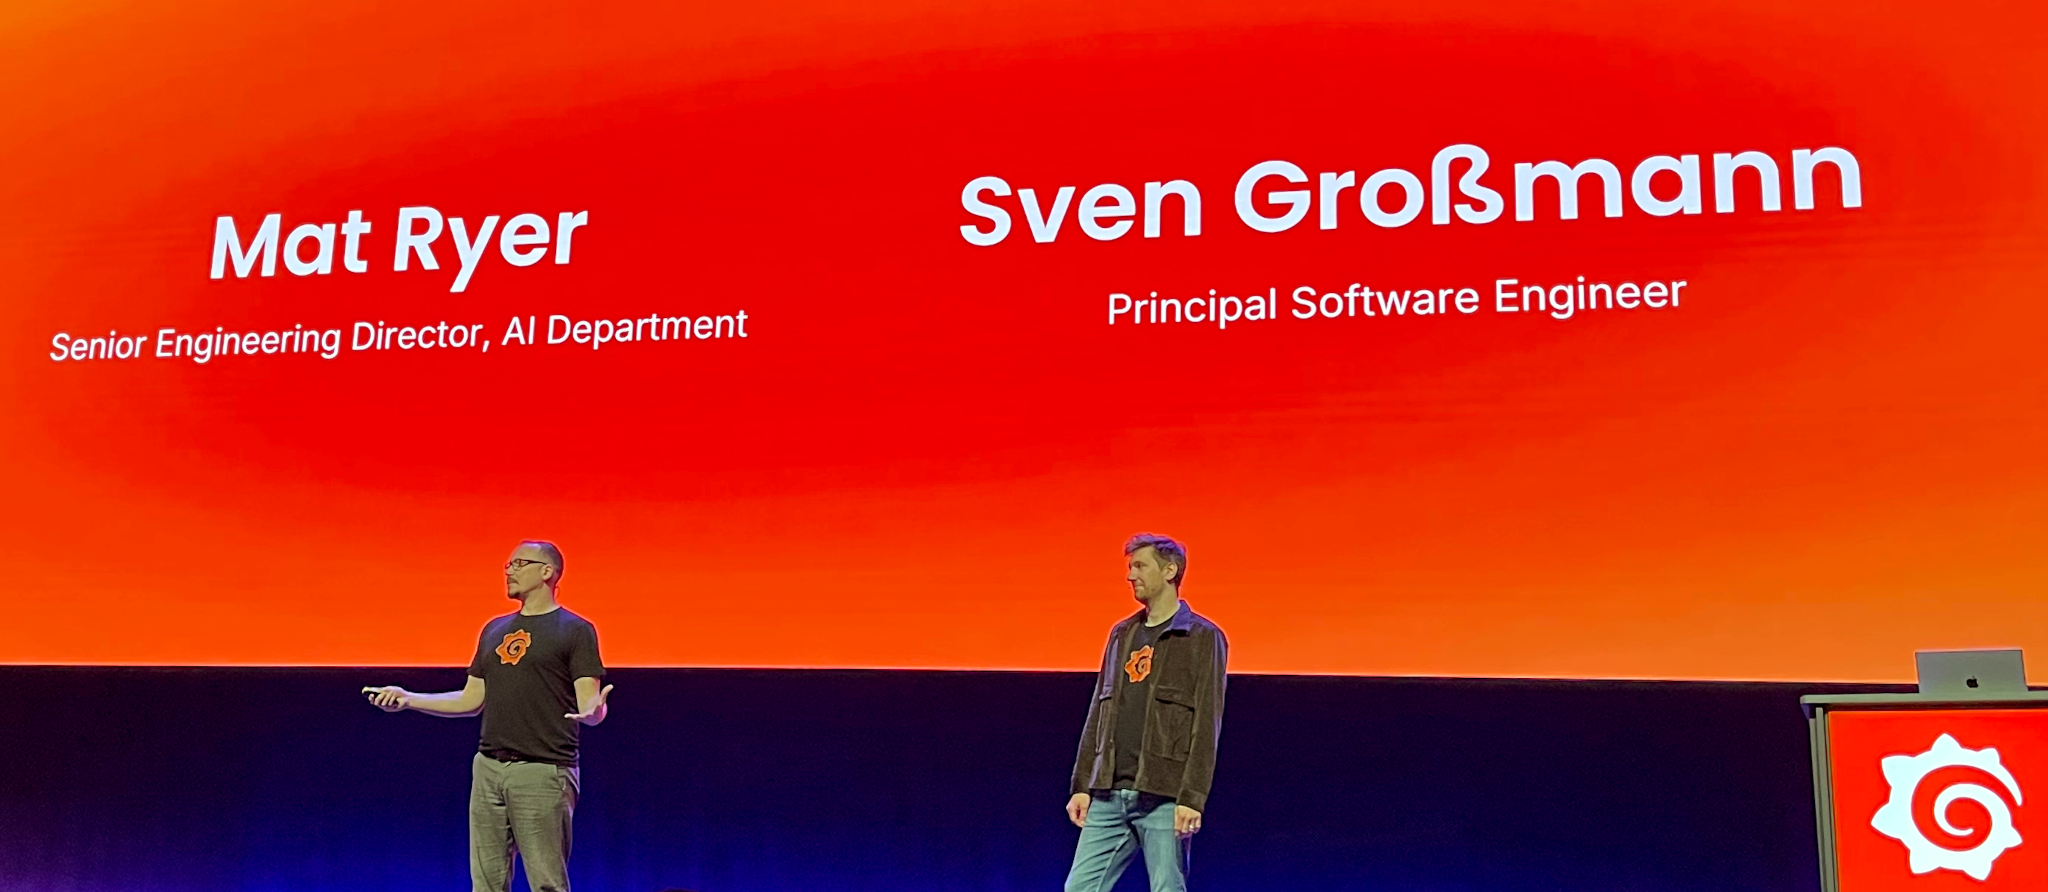
No modern conference would be complete without discussing generative AI. Mat Ryer kicked off that discussion (and he would end up serving as the Master of Ceremonies for most of the conference).
There were two main areas to cover with respect to AI: the new AI assistant, and using Grafana for AI observability.
Sven Großmann talked about Grafana Assistant. One thing to understand about Grafana is that their are three main versions: Open Source, Enterprise and Cloud. Both the Open Source and Enterprise versions are designed to be run “on prem”, and Grafana Cloud is a hosted option. Cloud has a rolling release cycle, and a lot of features hit it first, such as the new AI powered Assistant.
Grafana gets a lot of AI stuff right, and having this Assistant makes it easier for users to get the most out of the application. Data science is hard, and that can make data visualization difficult as well. For example, if you are polling for a value periodically, what happens when that poll fails? Usually applications store a null value (NaN) but then what do you do when you try to take an average? Do you treat the unknown values as truly null or do you treat them as zero? For example, if I have a 1GB/sec circuit that goes down, and for an hour I only get one sample, if I treat the missing values as unknown the average bandwidth for that hour would be reported as 1GB/sec, even though no traffic moved through it for most of that time.
Of course you can tell Grafana to treat those unknowns as zeroes, but it takes at least one extra step. With Grafana Assistant you could just tell the agent how you wanted those values to be evaluated, and it would do the work for you.
This will be very useful to both experienced and new Grafana users, and the big announcement was that it was now available in Open Source and Enterprise.
The feature does require a Cloud account, but they have a free tier that should provide enough credits for most people to use it. I did ask about why there wasn’t an on-prem version and the answer was simply time to market. They wanted to get this feature out as soon as possible, and it just wasn’t feasible to build it to run locally.
I get that. At OpenNMS is was always nice when a support customer gave us ssh access into their system, as it was quicker to troubleshoot issues when we could go “hands on”. I can’t imagine the challenges in building a local version of this assistant, from finding a model that would perform well with a license suited for local use, to determining the minimum hardware requirements and then troubleshooting the issues that are sure to arise.
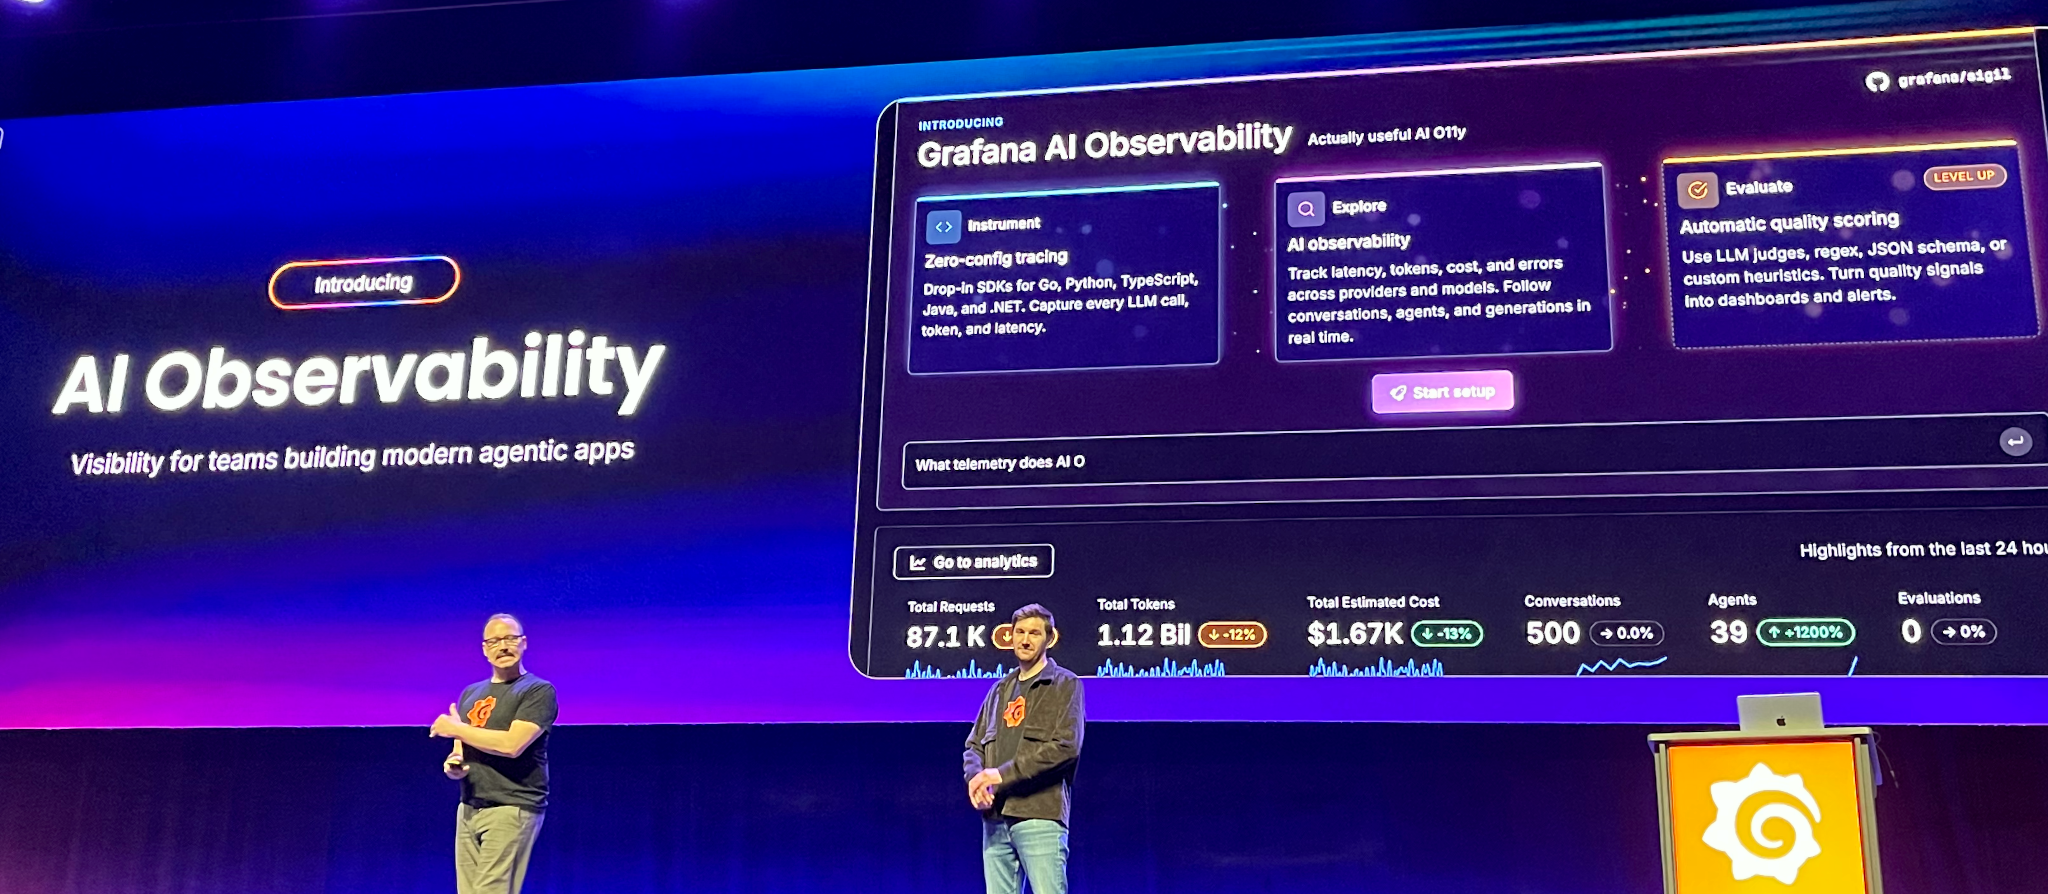
The second big “AI” thing was observability applied to AI platforms and applications. Grafana will allow you to instrument you AI applications and agents to capture every LLM call, token usage and latency. This ability to follow conversations, agents and generations in real time will help provide a better user experience while keeping an eye on cost.
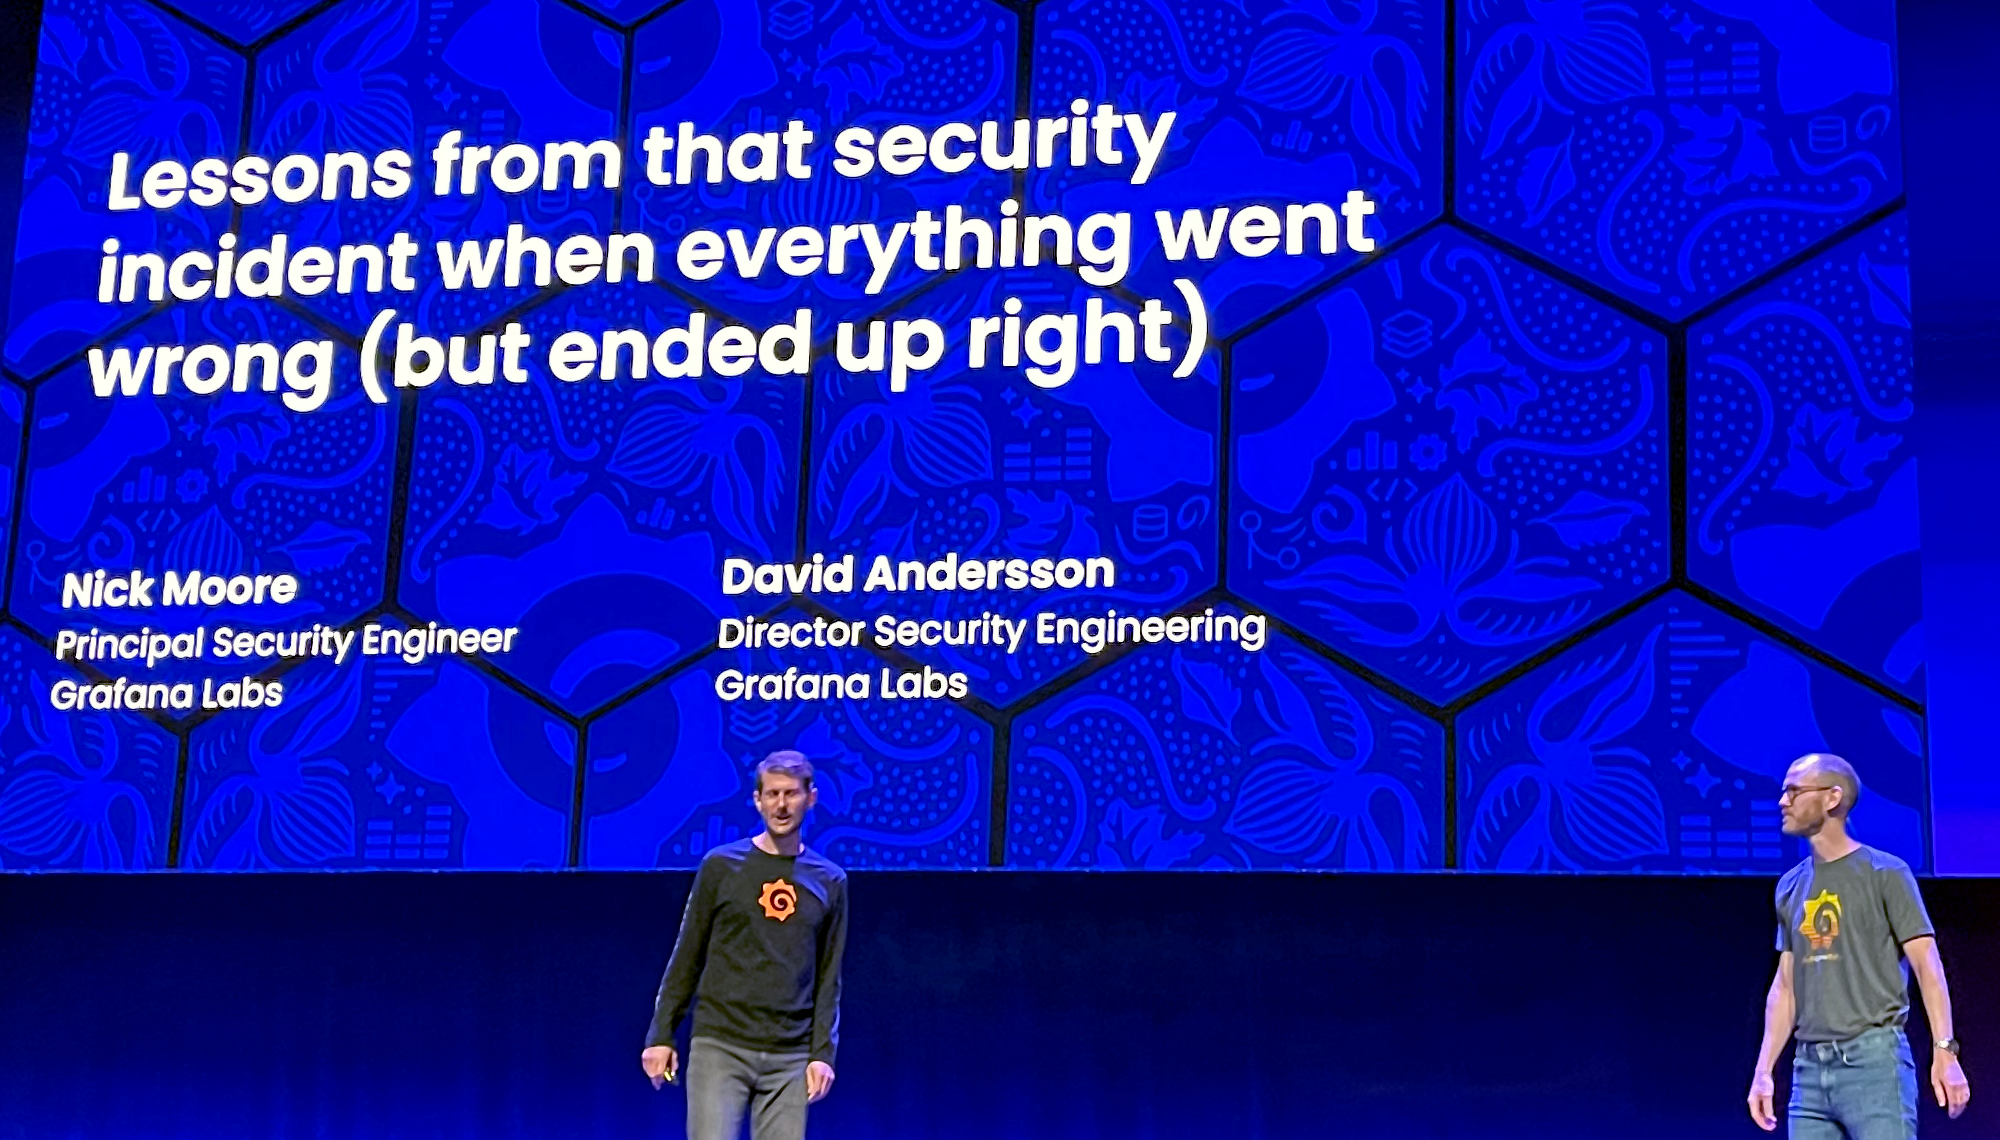
The final presentation of the morning took a slight detour. Back in May of 2025 there was a change made to a GitHub Action on the Grafana repo that allowed for an outside party to access certain environment variables, including credentials. Instead of pull-request an action was uploaded that changed it to pull-request-target, which was not safe.
The presentation was given by Nick Moore and David Andersson, and it was cool to see how this was caught and fixed. I also learned about “canary” credentials. Since most attacks like this are automated, when a bad actor gets access to credentials they are likely to explore just what kind of access they provide. By creating “dummy” credentials that should never be used, it is trivial to set up an alert when and if they are. It is an easy way to get a warning that something is wrong.
This was followed by the first morning break, and I would spend the next couple of hours talking to people around the expo hall.
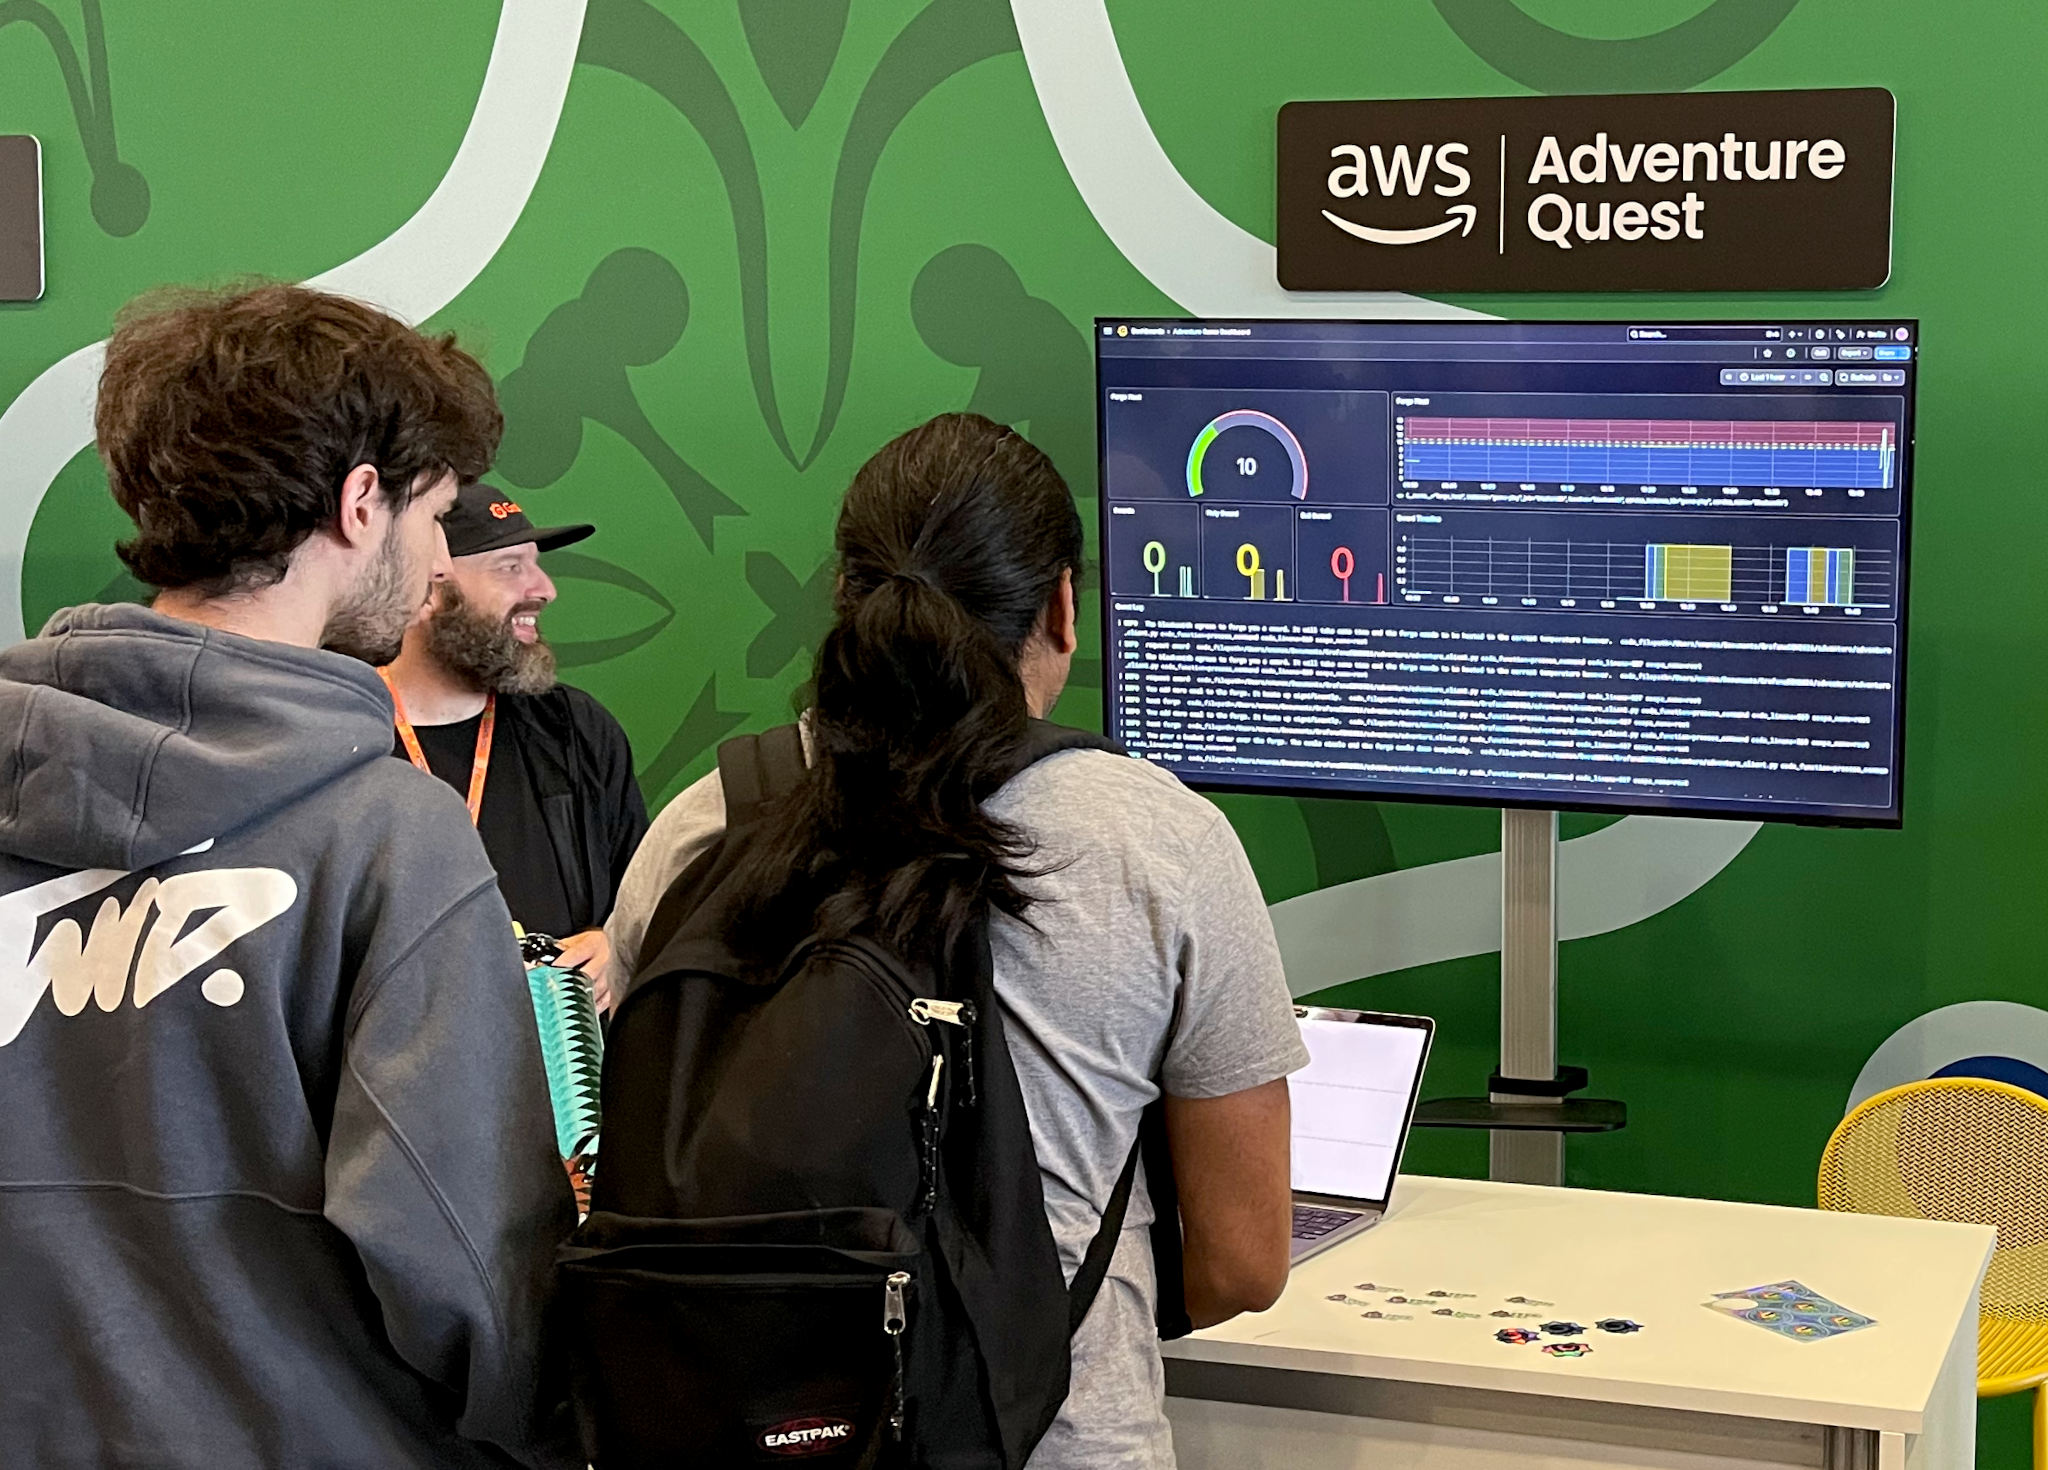
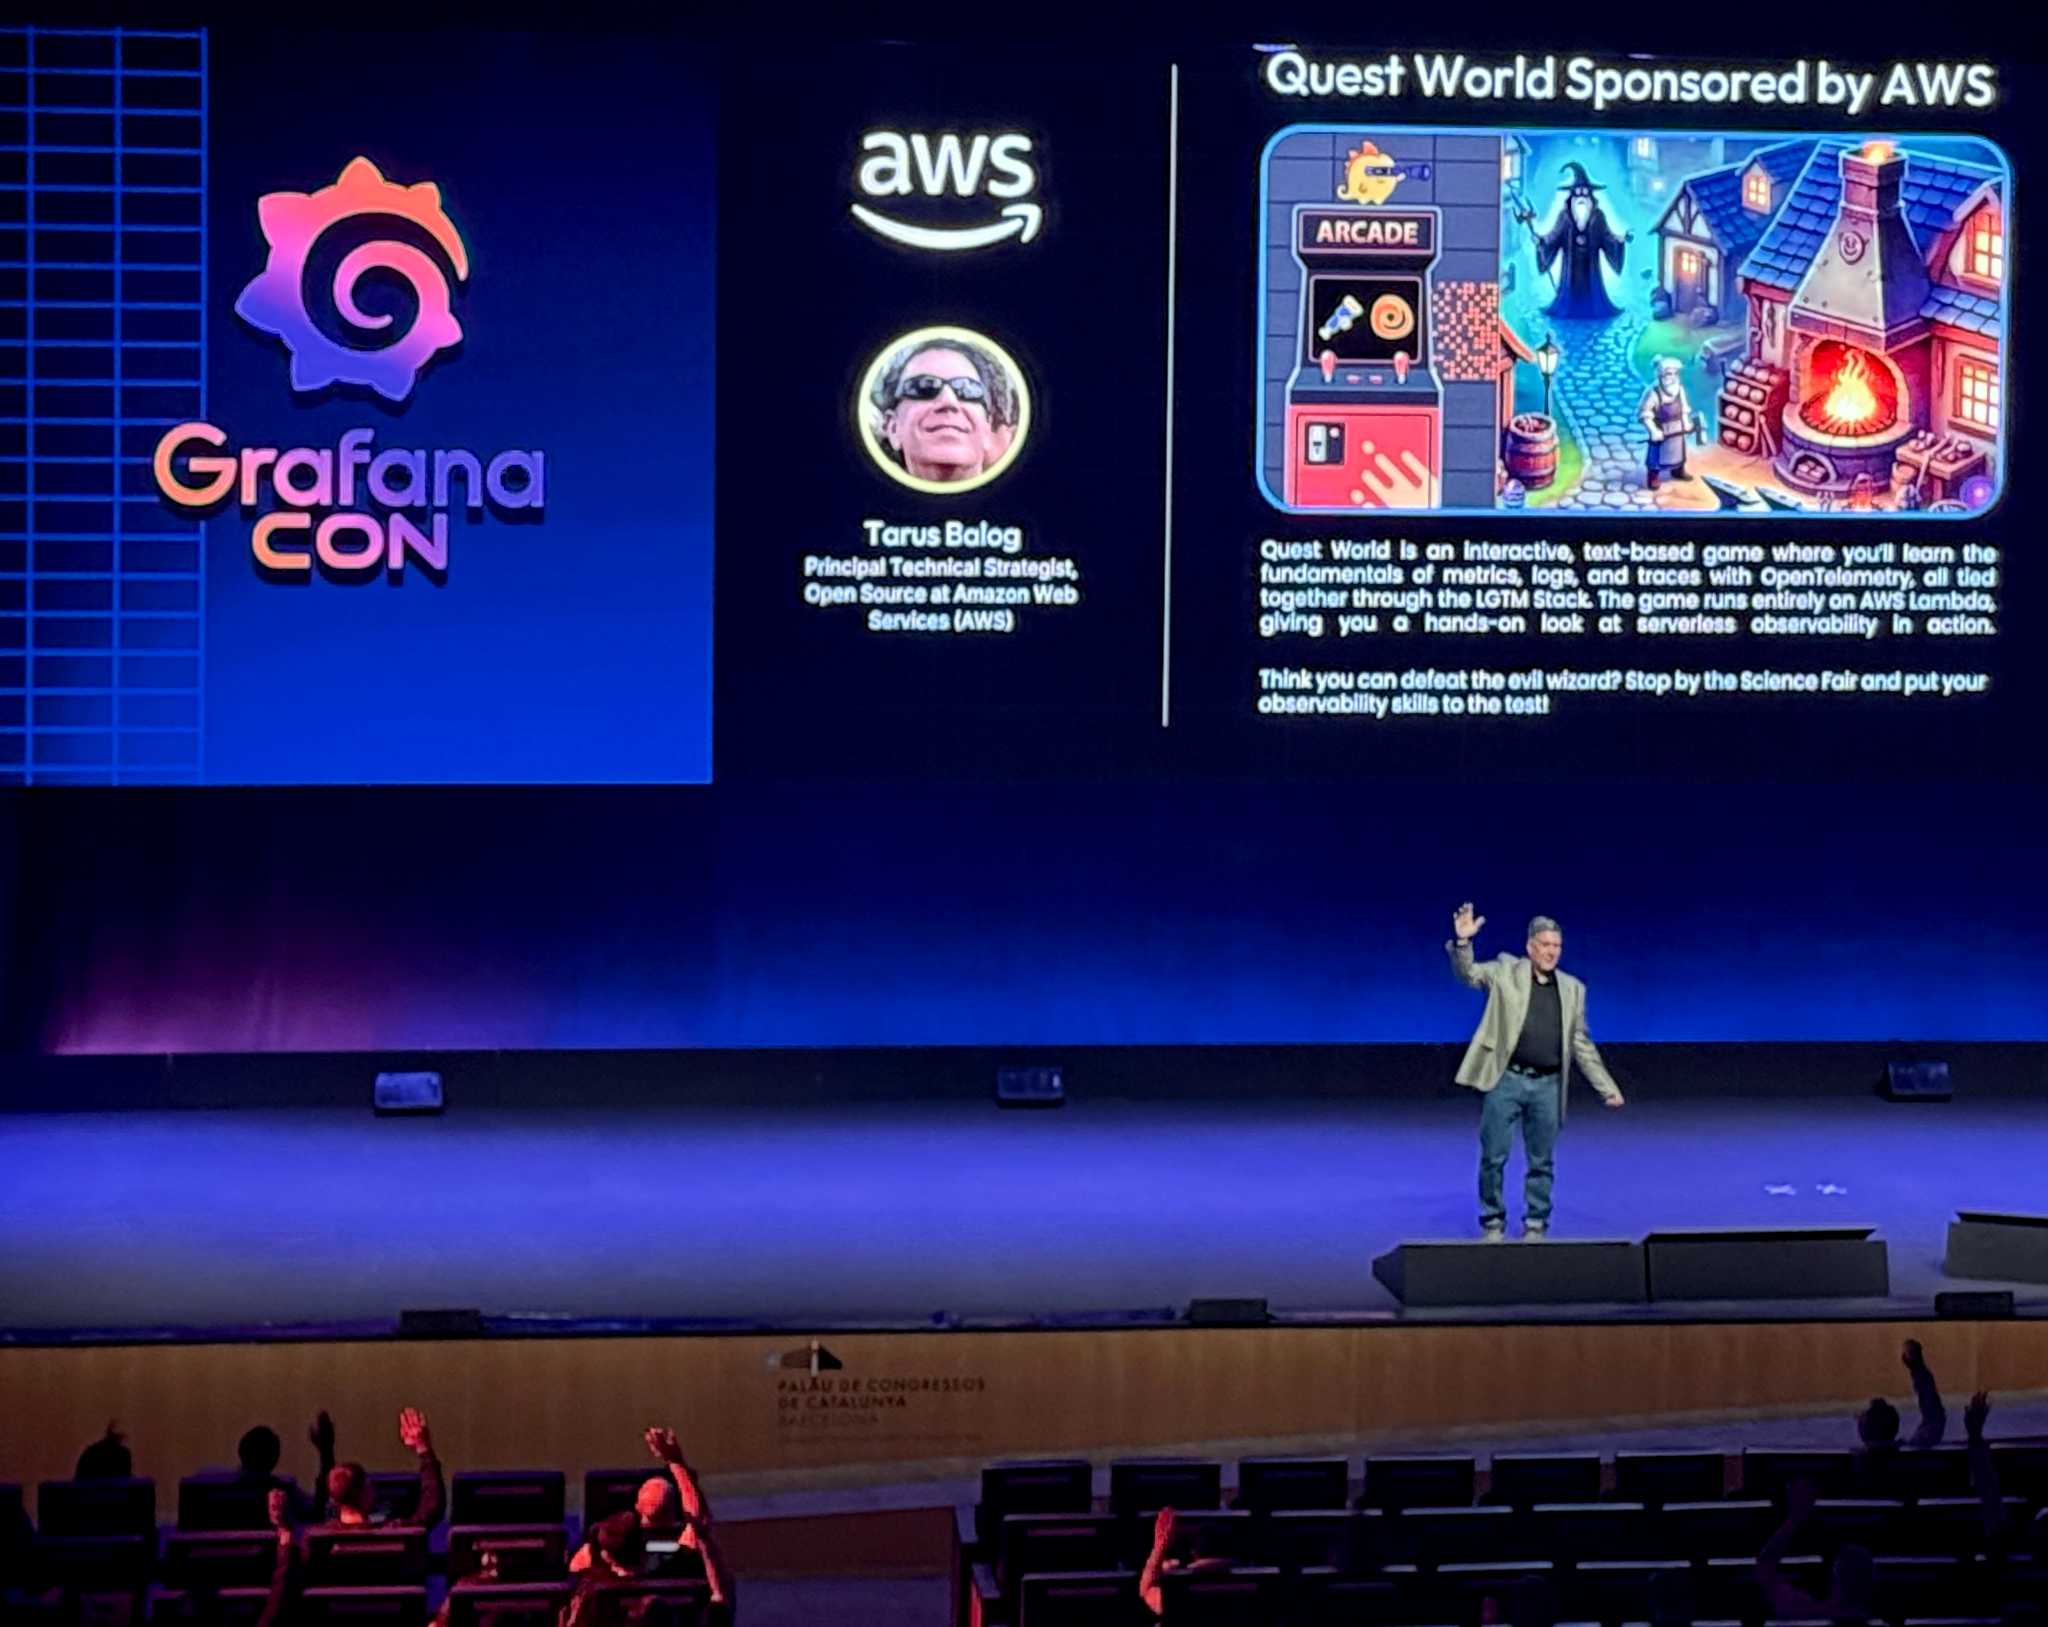
My first stop was the AWS booth which featured “Adventure Quest”. Using a laptop, attendees were given the chance to solve an old skool text adventure game with an observability focus, and winner got a sword (not a real sword but an inflatable one so they could take it home through the airport).
It was being run by Guillermo Ruiz who works for AWS out of the Madrid office. It is always fun to meet cool coworkers at conferences, as we probably would never meet otherwise.
In the center of the Expo Hall there was a big round “Ask the Experts” area, and I introduced myself to several of the “Grafanistas” working there. Grafana is a fully remote company (well, due to legal reasons they have a physical office in Japan) but there was a large contingent of folks from Munich. I also got to spend some time talking with Ted Young, who was dealing with a large electrical spike that hit his house back home. As someone who travels a lot I can attest that things are most likely to go wrong at home when you are away.
I then went downstairs for lunch. Like many conferences the meal was served in a box, but unlike other conferences the food was really good for “in a box” type fare. The main course was a “poké bowl” with a fish, meat and veggie option, but then you got an additional sandwich, plus fruit, plus chips … it was pretty tasty. There was so much food I didn’t envy the presenters that afternoon since everyone would be sleepy and the chairs in the auditorium were really comfortable.
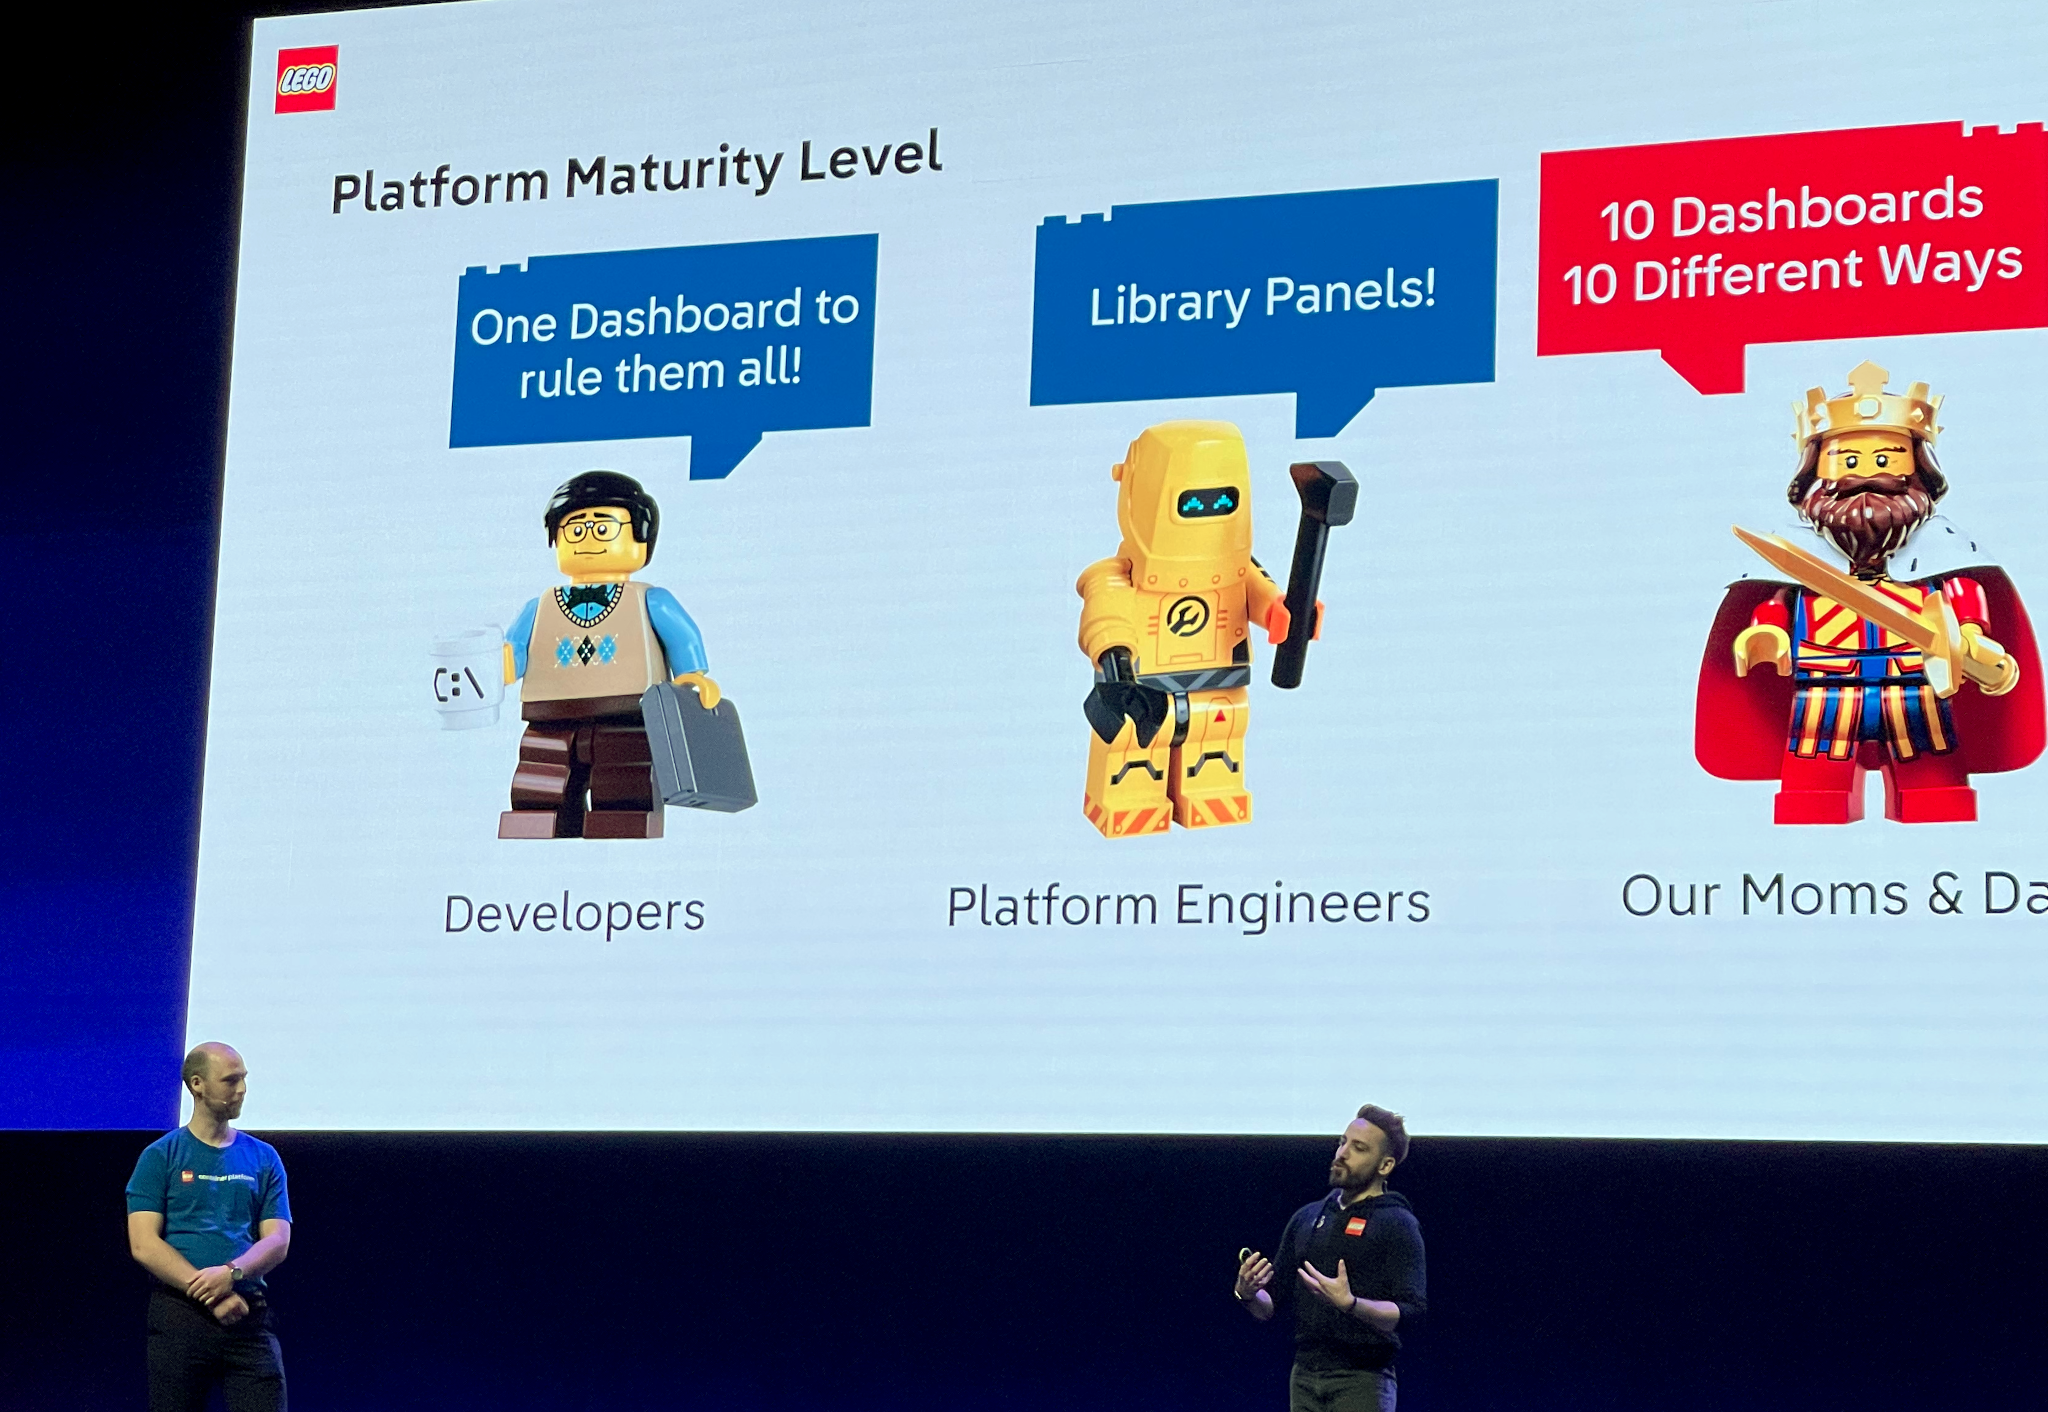
I was late to the afternoon sessions and came in during the end of a presentation by two engineers from LEGO, Paul Farver and Lorenzo Setale.
I always enjoy it when you get to hear about tech choices made by a company that is also a household name, and for once I was okay with people using LEGO figures in their slides (grin)
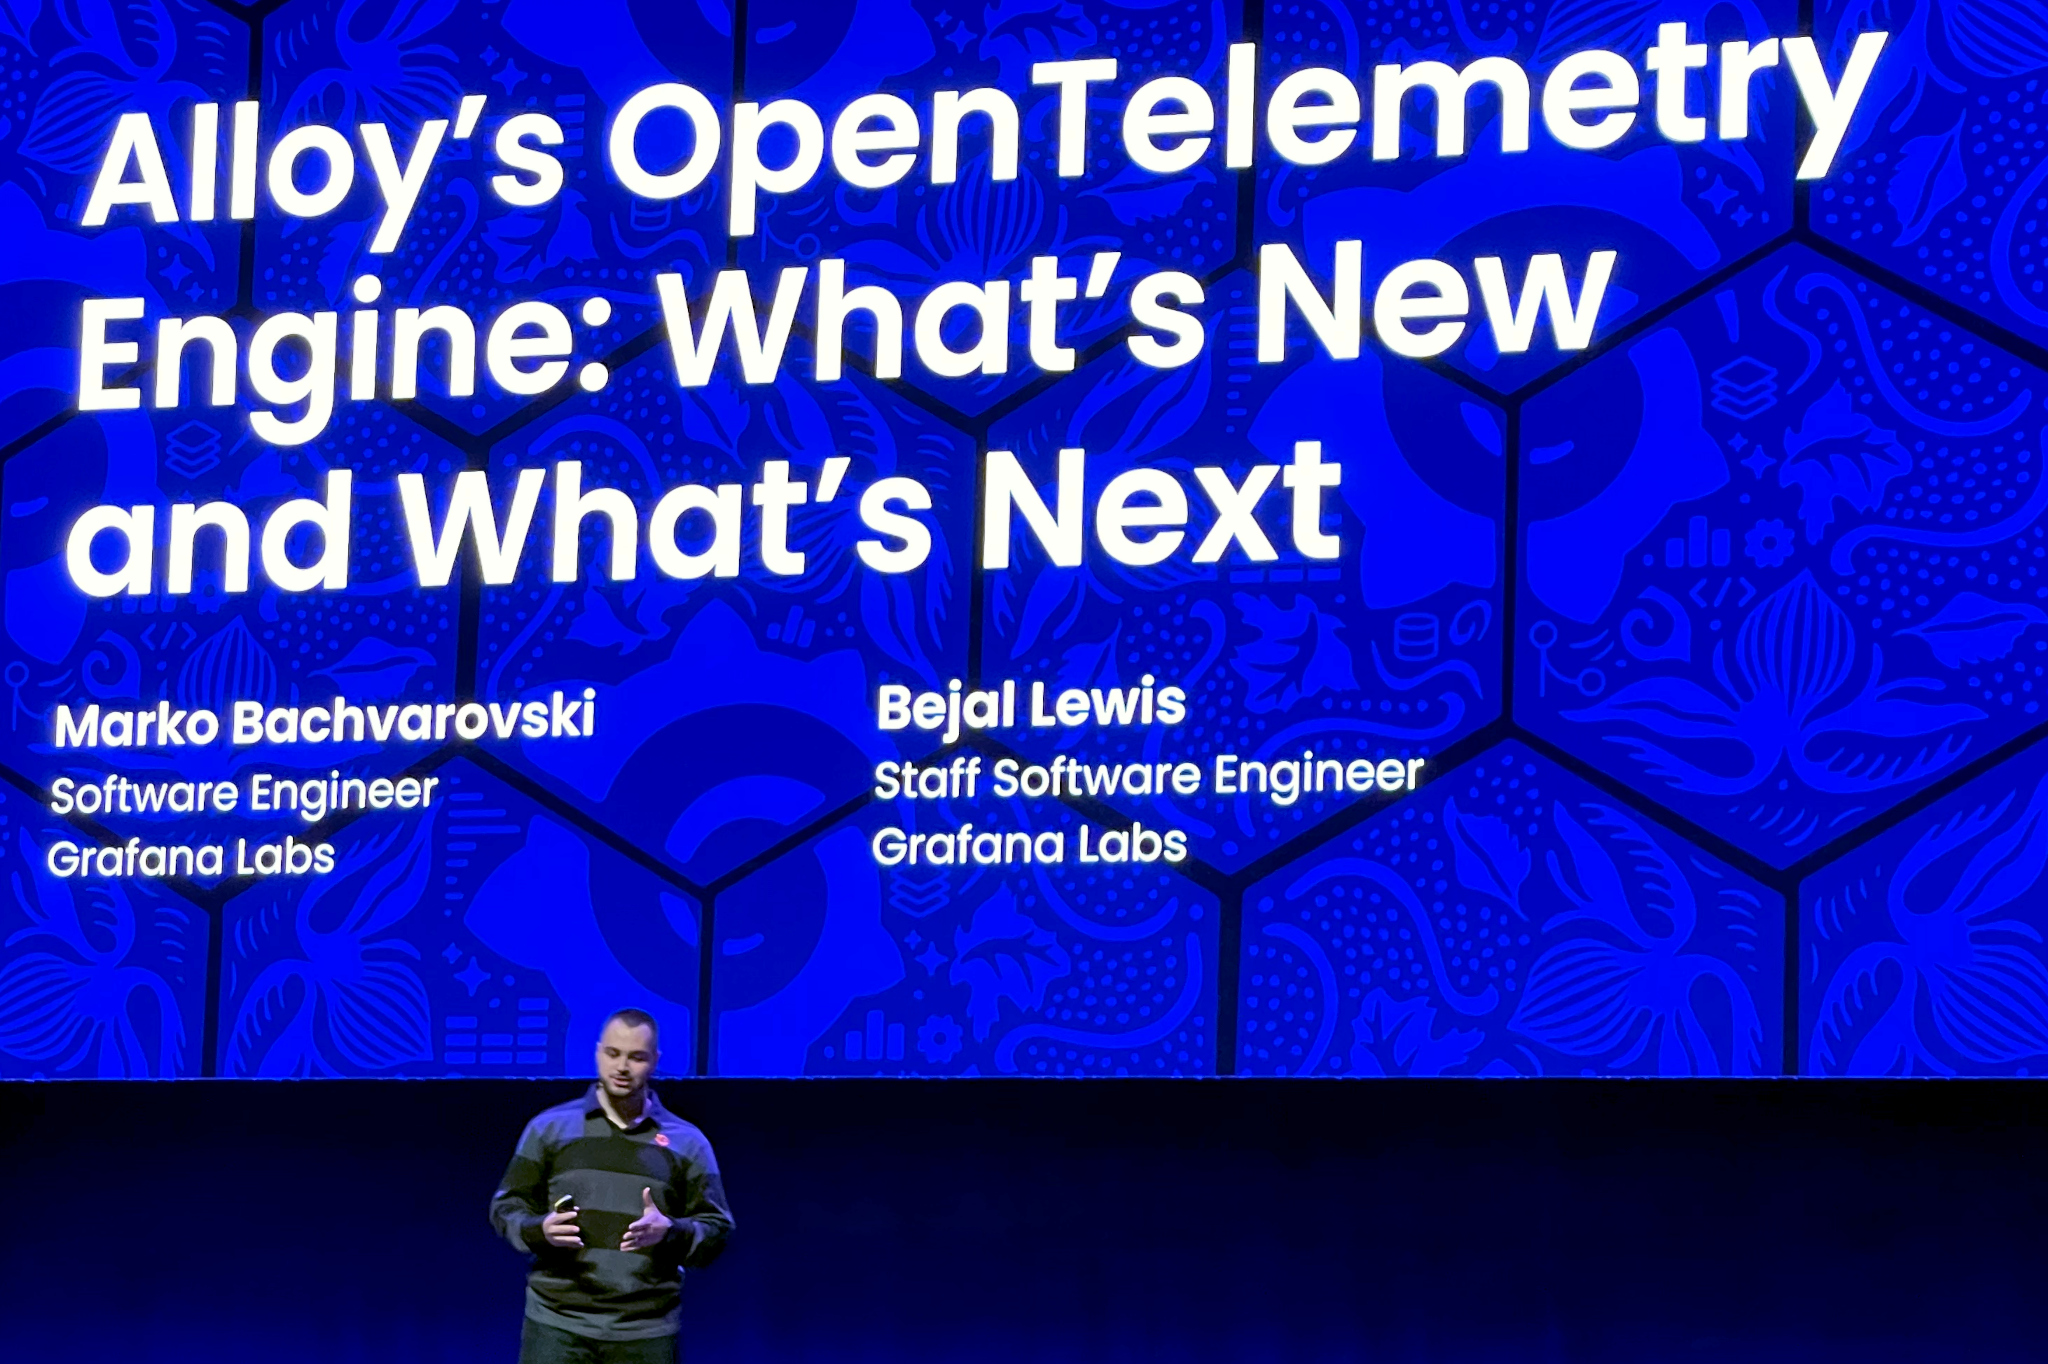
The next presentation was from Marko Bachvarovski and Bejal Lewis on Alloy. Alloy is a telemetry collector that is meant to replace separate agents with one configurable pipeline. As one might imagine, OpenTelemetry plays an oversized role and this talk covered the roadmap for OTel integration with Alloy.
I missed the next talks because I was backstage getting ready for my few minutes of fame. I had been asked to represent AWS, and I was to go on just after the presentation of the Golden Grot awards.
The Golden Grot recognizes innovation in Grafana, and this years winners included a person (Mohamed Adam) who built a tracker for the aurora borealis, another (Jackson Sweeney) who created a dashboard to provide visibility for the Blue Ghost Mission 1 lunar lander, and two examples (by Oren Lion and Dhananjay Yadav) of AI observability driven by Grafana Assistant.
I had to follow that (grin) and I told Mat Ryer that I would start off by asking for one more round of applause for the winners, but when I got onto the ginormous stage all I saw were people heading for the exits (it was break time), and I forgot it in my goal to get their attention before they left. Apologies for the omission.
During the break Will Nunes gave me a cool swag bag. I had fallen in love with Grot, and I asked if he could find me a plush toy version.
Whoever designed Grot deserves a gold star, mainly because you can use the image on its goggles to show different things. By default it is usually a line graph, but I’ve also seen a bar chart as well as red Xs when there was an error. Wonderful.
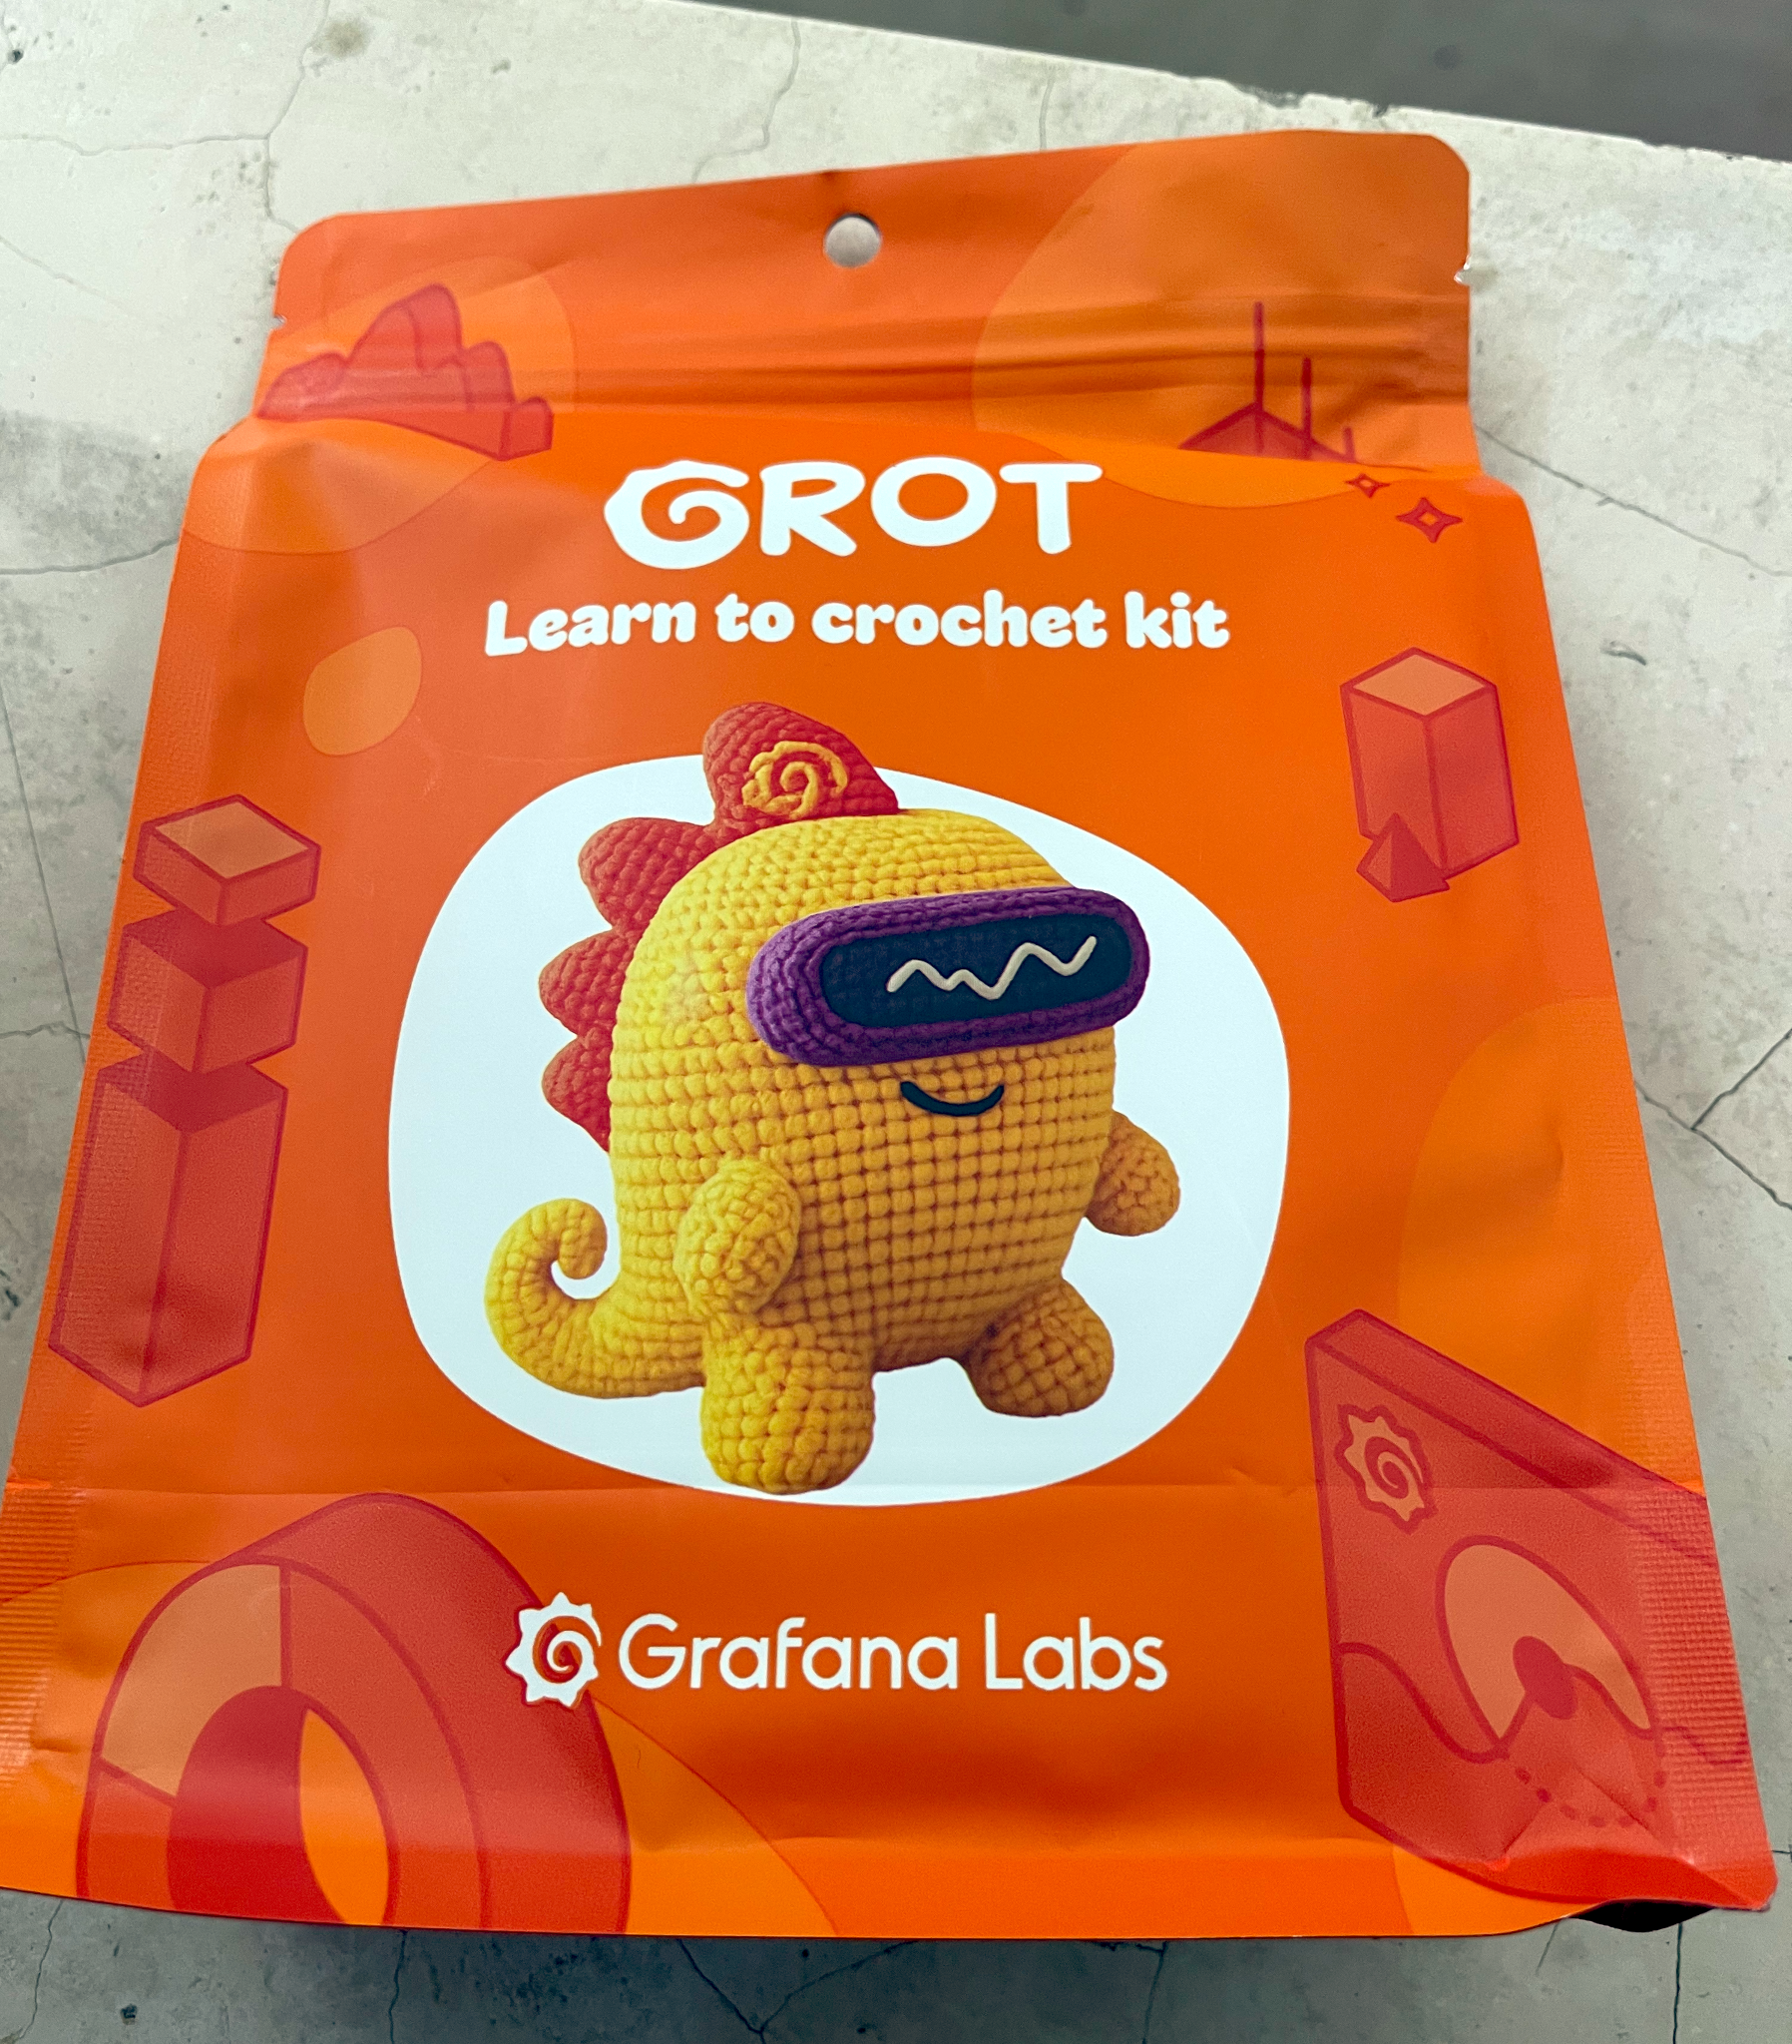
In any case, he didn’t have a plush toy, but in true Grafana fashion, he gave me a kit where I can make one on my own. Sweet.
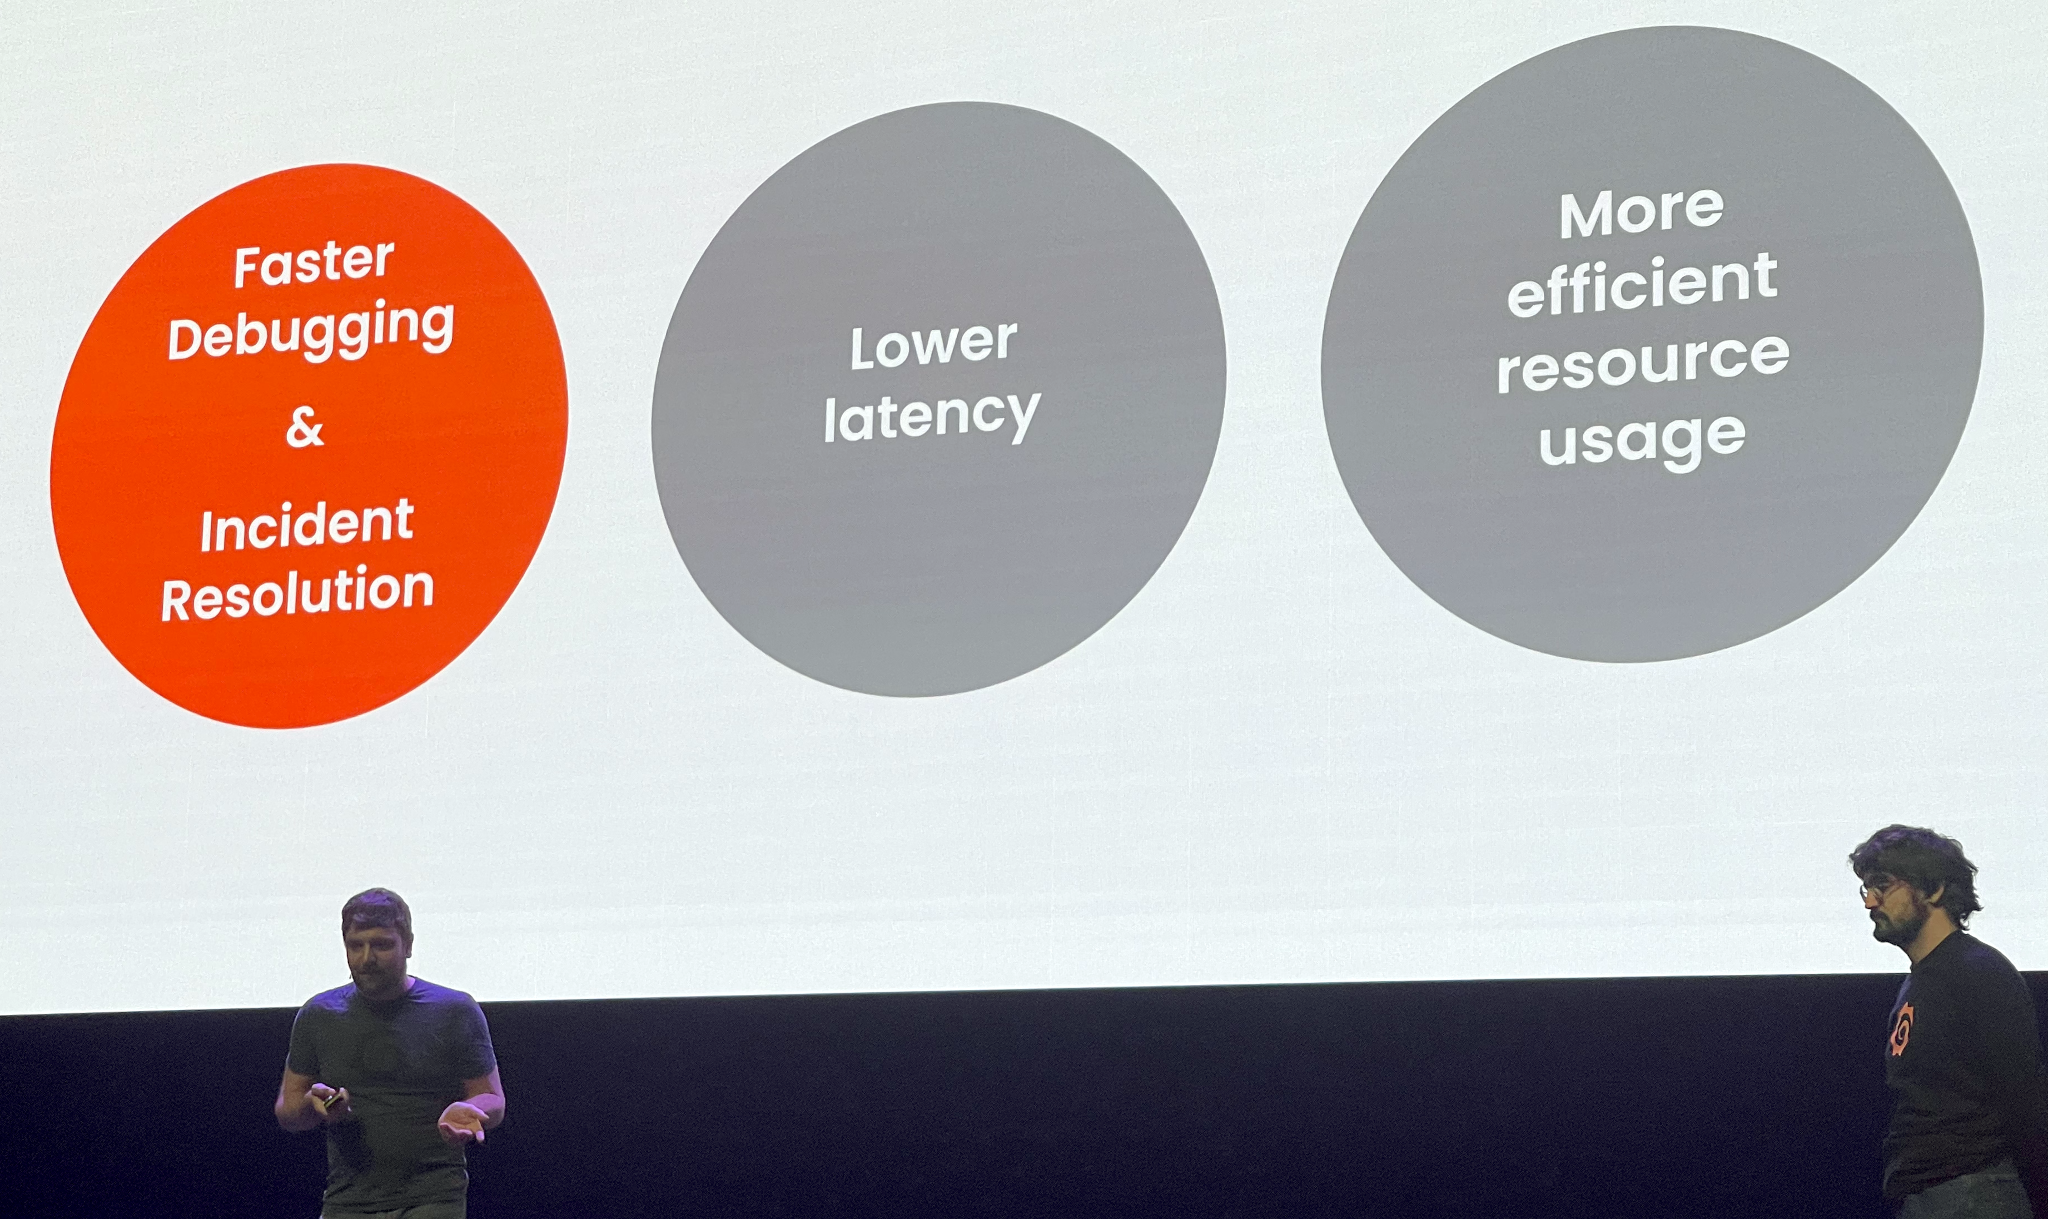
I caught the tail end of a talk about Pyroscope 2.0 by Christian Simon and Alberto Soto.
This is a re-architecture of the open source continuous profiling solution that helps pinpoint resource usage from running applications.
When I first got into monitoring, it was really cool when we could first detect when a server was experiencing a high load. But then the question became “why?”. The next step was to identify the process responsible, which later grew into application monitoring where specific parts of the code can be identified as the source of the resource consumption.
The downside is that determining this information also costs resources, so there is a tradeoff. For example, I remember installing a BMC Patrol agent on a busy Oracle database and it took down the database. Not good.
Pyroscope 2.0 lowers both the resource cost and the complexity of deploying continuous profiling while adding a slew of new features, all of which integrate seamlessly with Grafana (’natch).
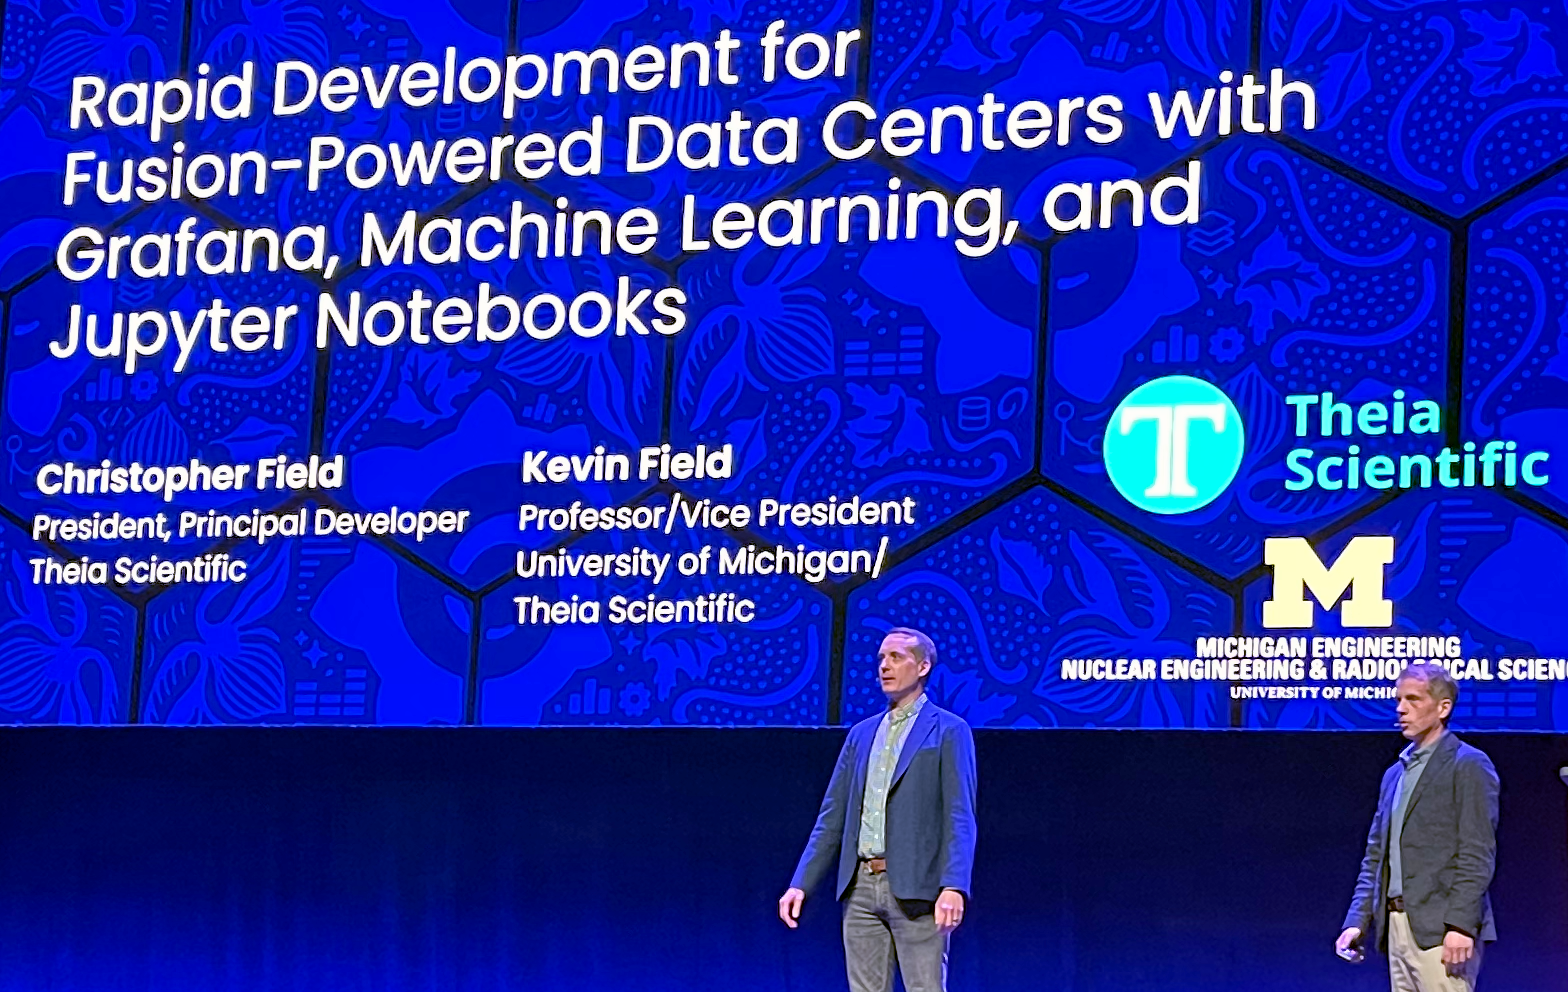
Christopher Field and Kevin Field of Theia Scientific then presented how they were combining their AI-powered microscopy analysis platform with Grafana to visualize scientific and engineering workflows. The example they used was fusion energy, which will end up powering the data centers of tomorrow.
When these systems actually exist in real life, the materials that make up the system will eventually be consumed and need to be replaced. By using Theia Scientific products and their machine learning system to examine these materials, that information can be fed into a Grafana dashboard for actionable insights into when they will need to be replaced for optimum energy production.
The final three presentations were shorter ten-minute talks on a variety of topics.
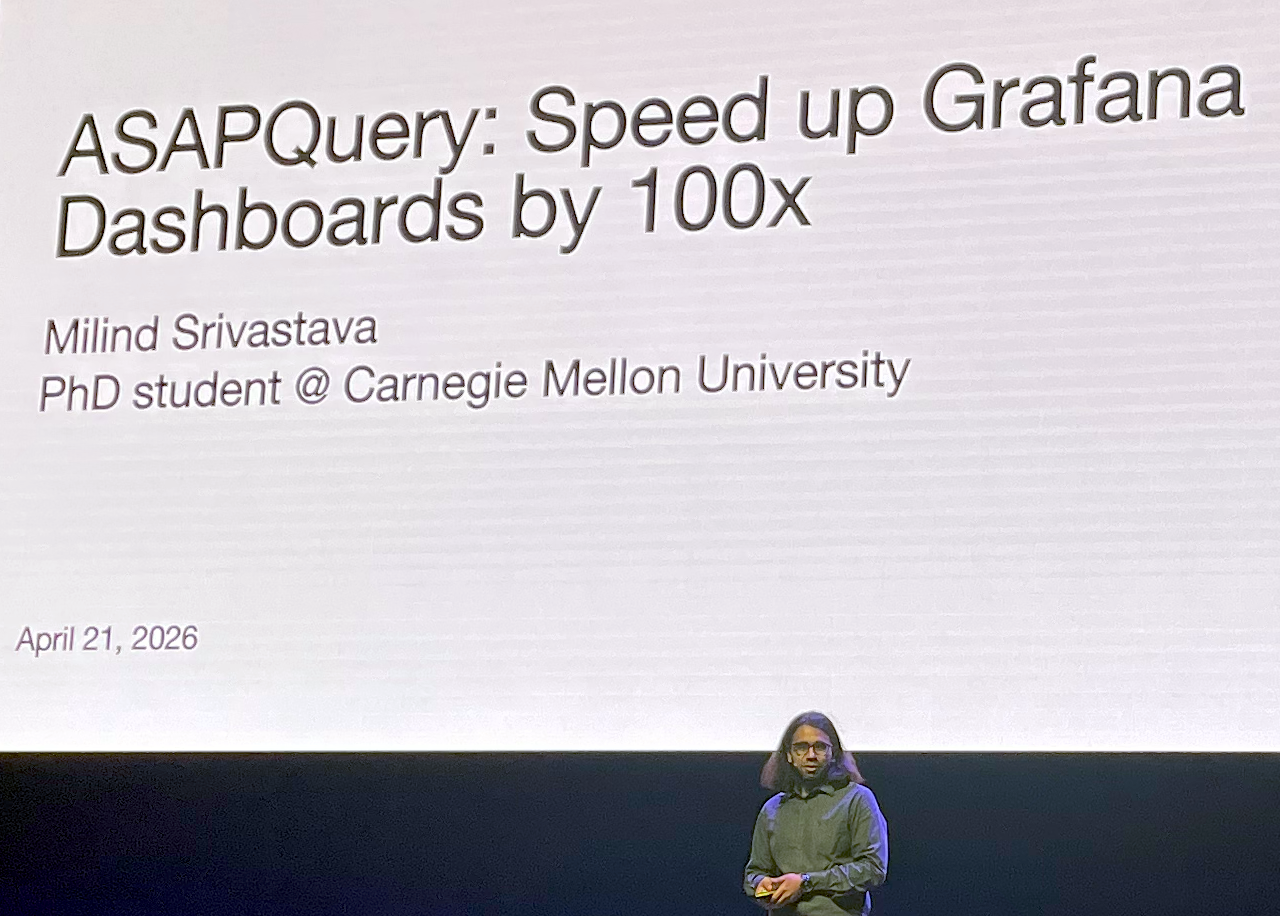
Milind Srivastava described a method of speeding up dashboards by optimizing the underlying queries. He called it ASAPQuery and I wish he’d written A$APQuery, but then again I’m a bit odd.
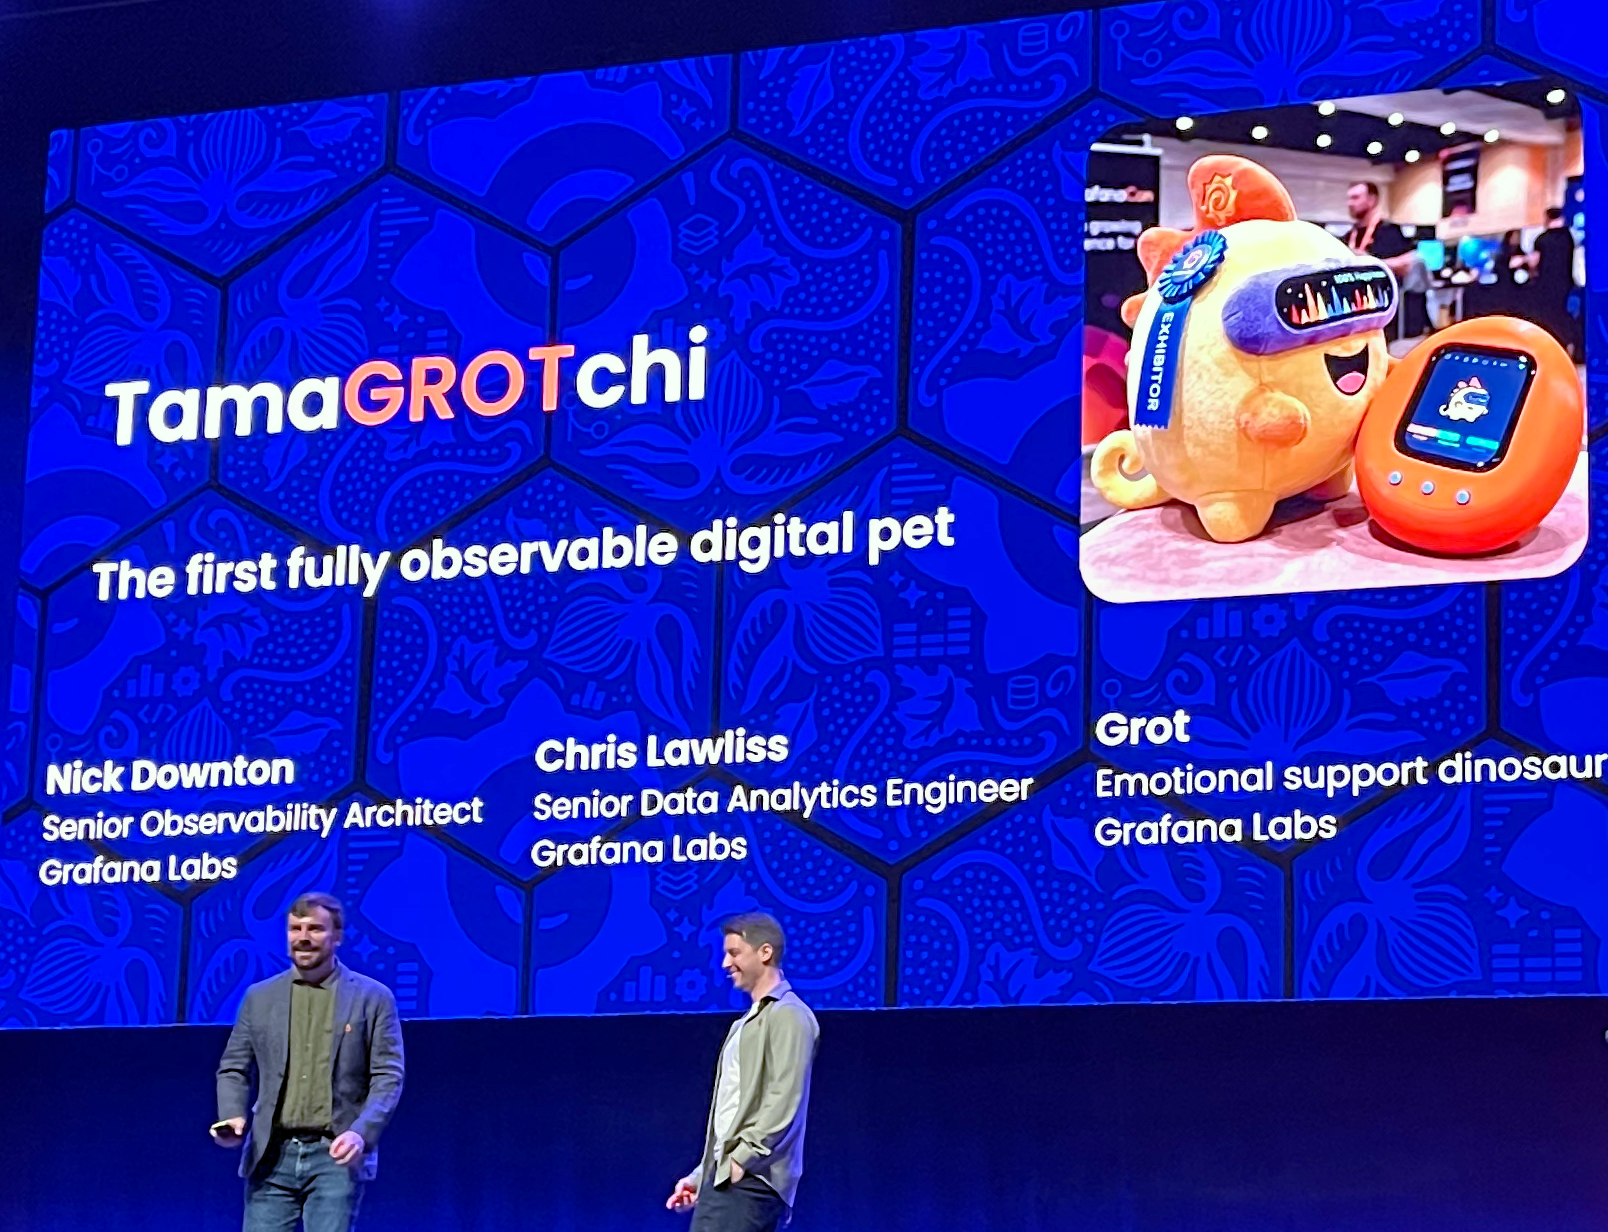
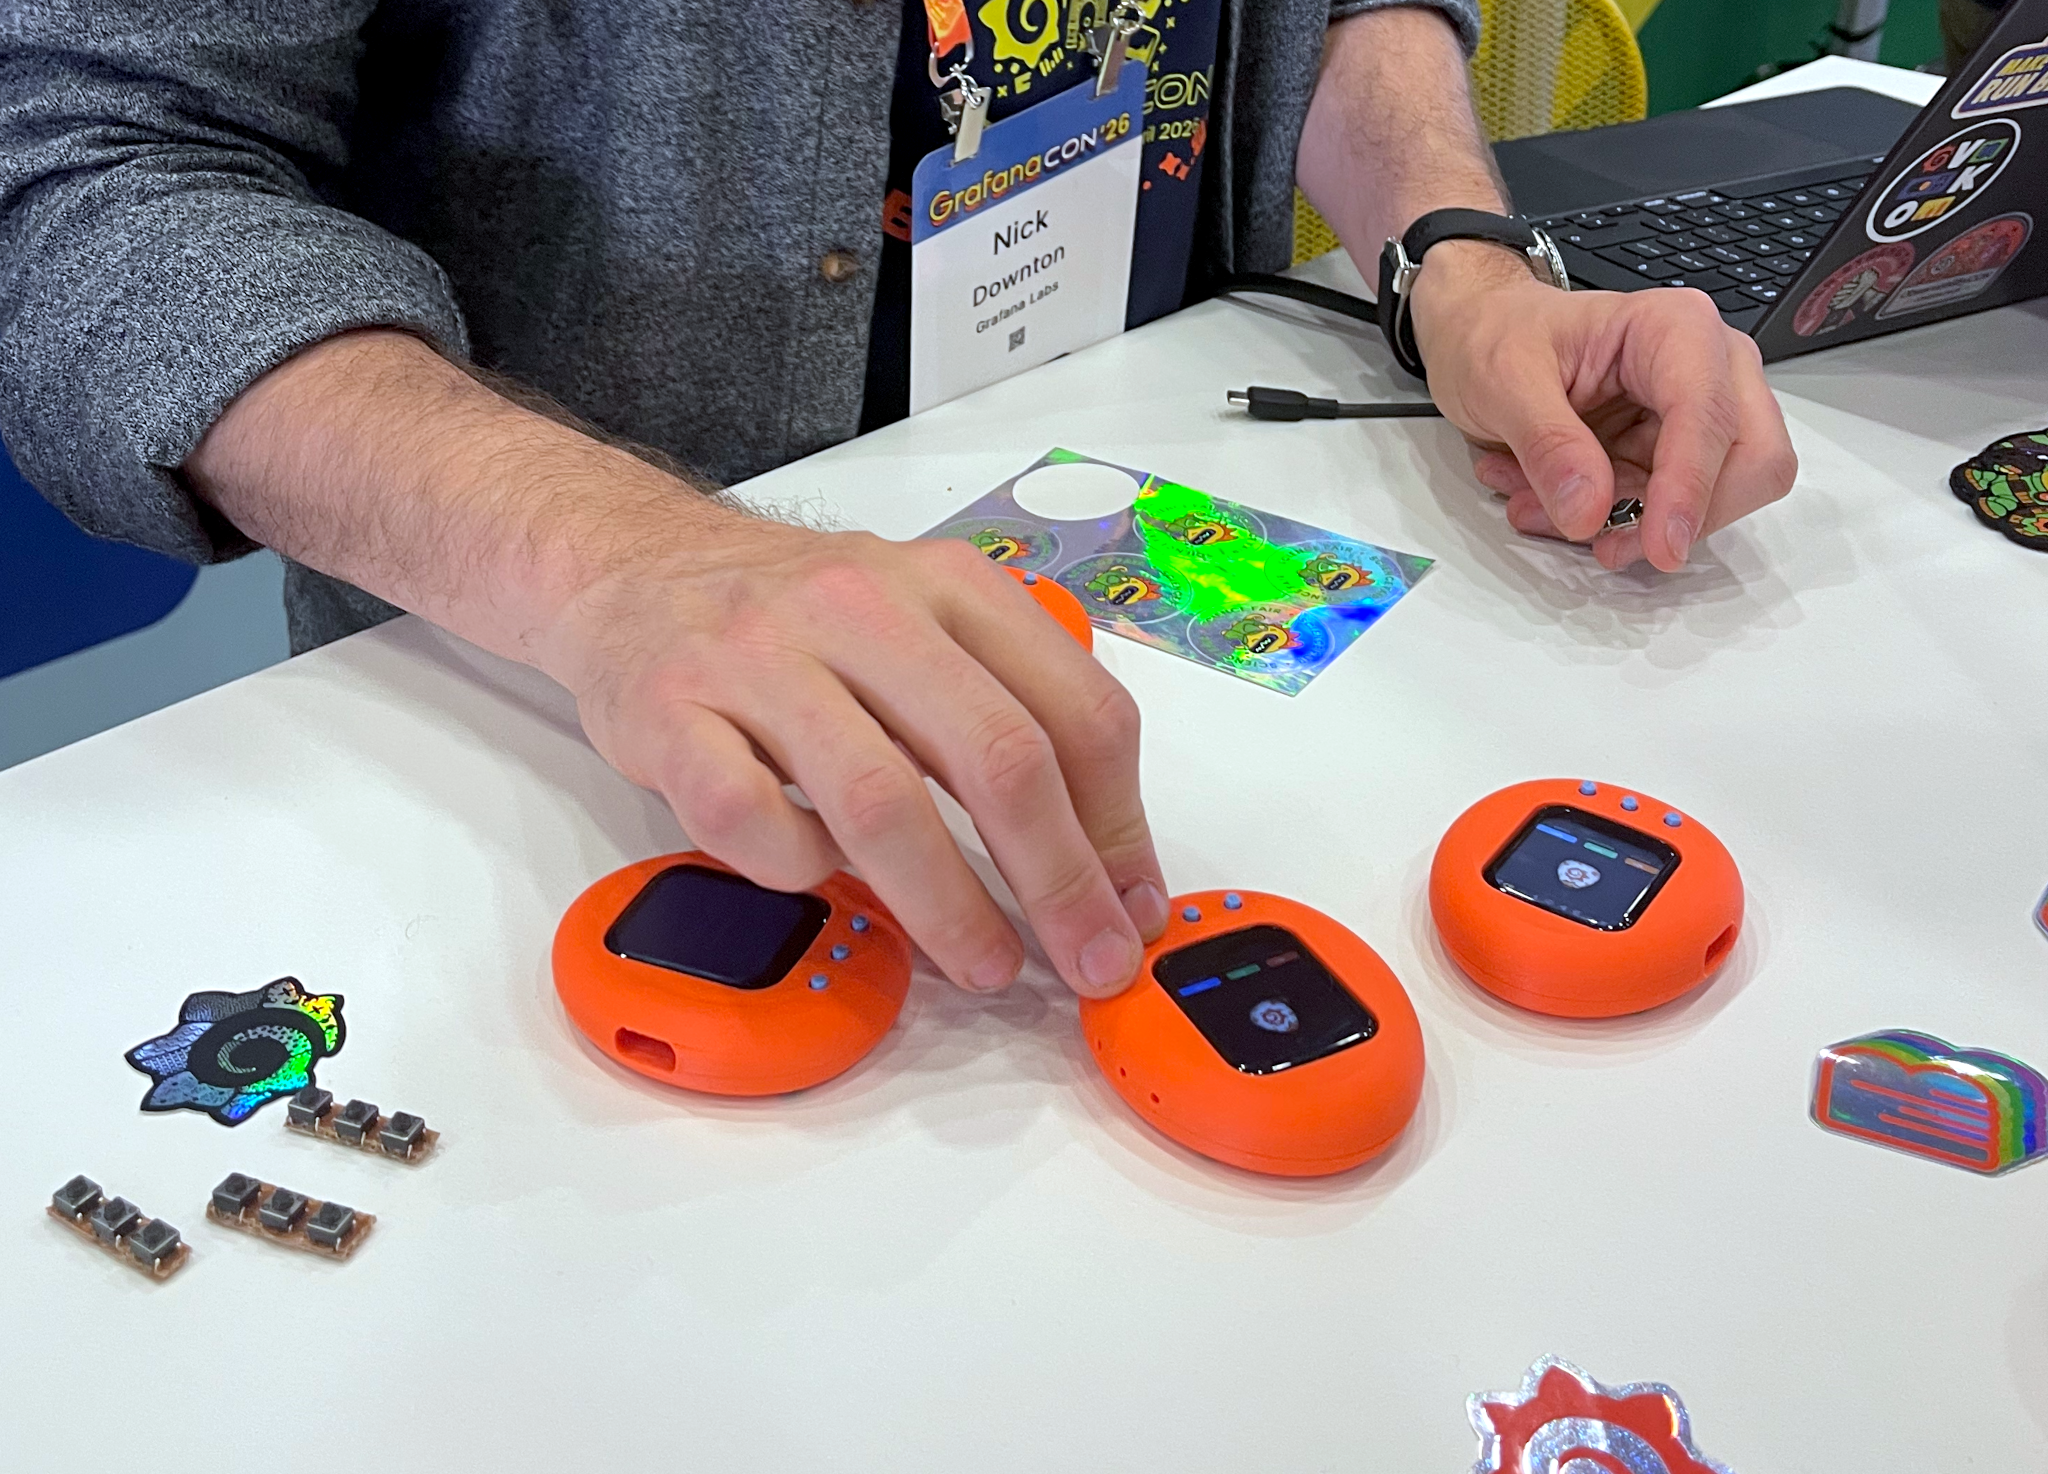
Nick Downton and Chris Lawliss showed off their TamaGROTchi device. This was a recreation of the famous Tamagotchi digital pet, but featuring Grot. I would later stop by their booth and play with one. It was pretty neat.
The final presentation was by Coleman Rollins on his GrotShotPro invention.
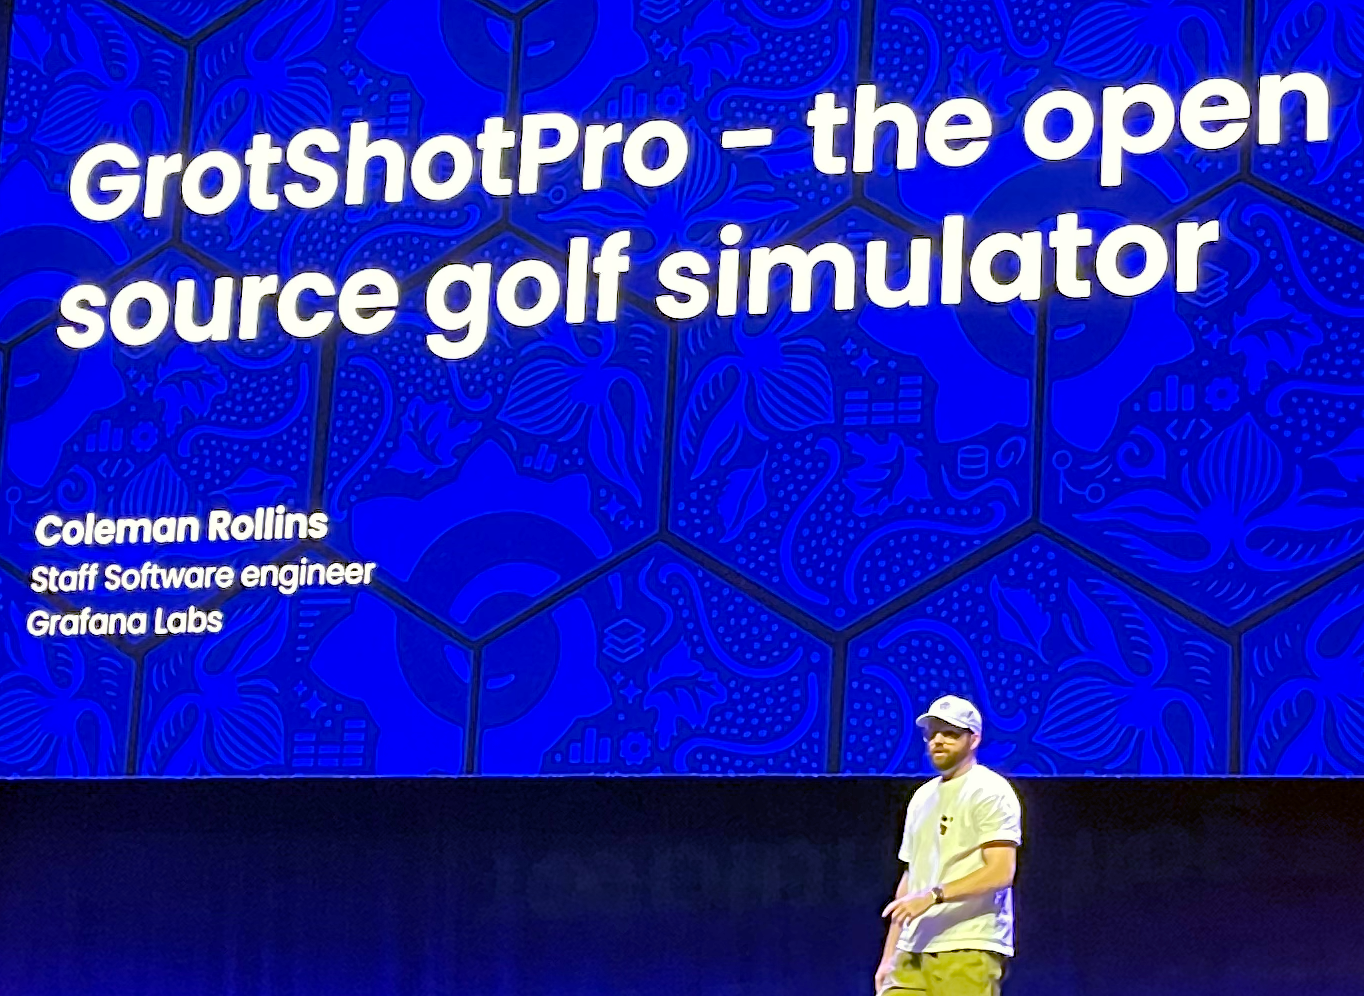
Rollins is an avid golfer and wanted to buy a device that would analyze his swing. Unfortunately, the good ones were too expensive so he decided to build his own, using Grafana to display the output and suggest improvements. I am not a golfer but I did enjoy his discussion of the two types of radar he used in his device.
Whew. If any of my three readers are still with me, please remember that this was just the end of Day 1.
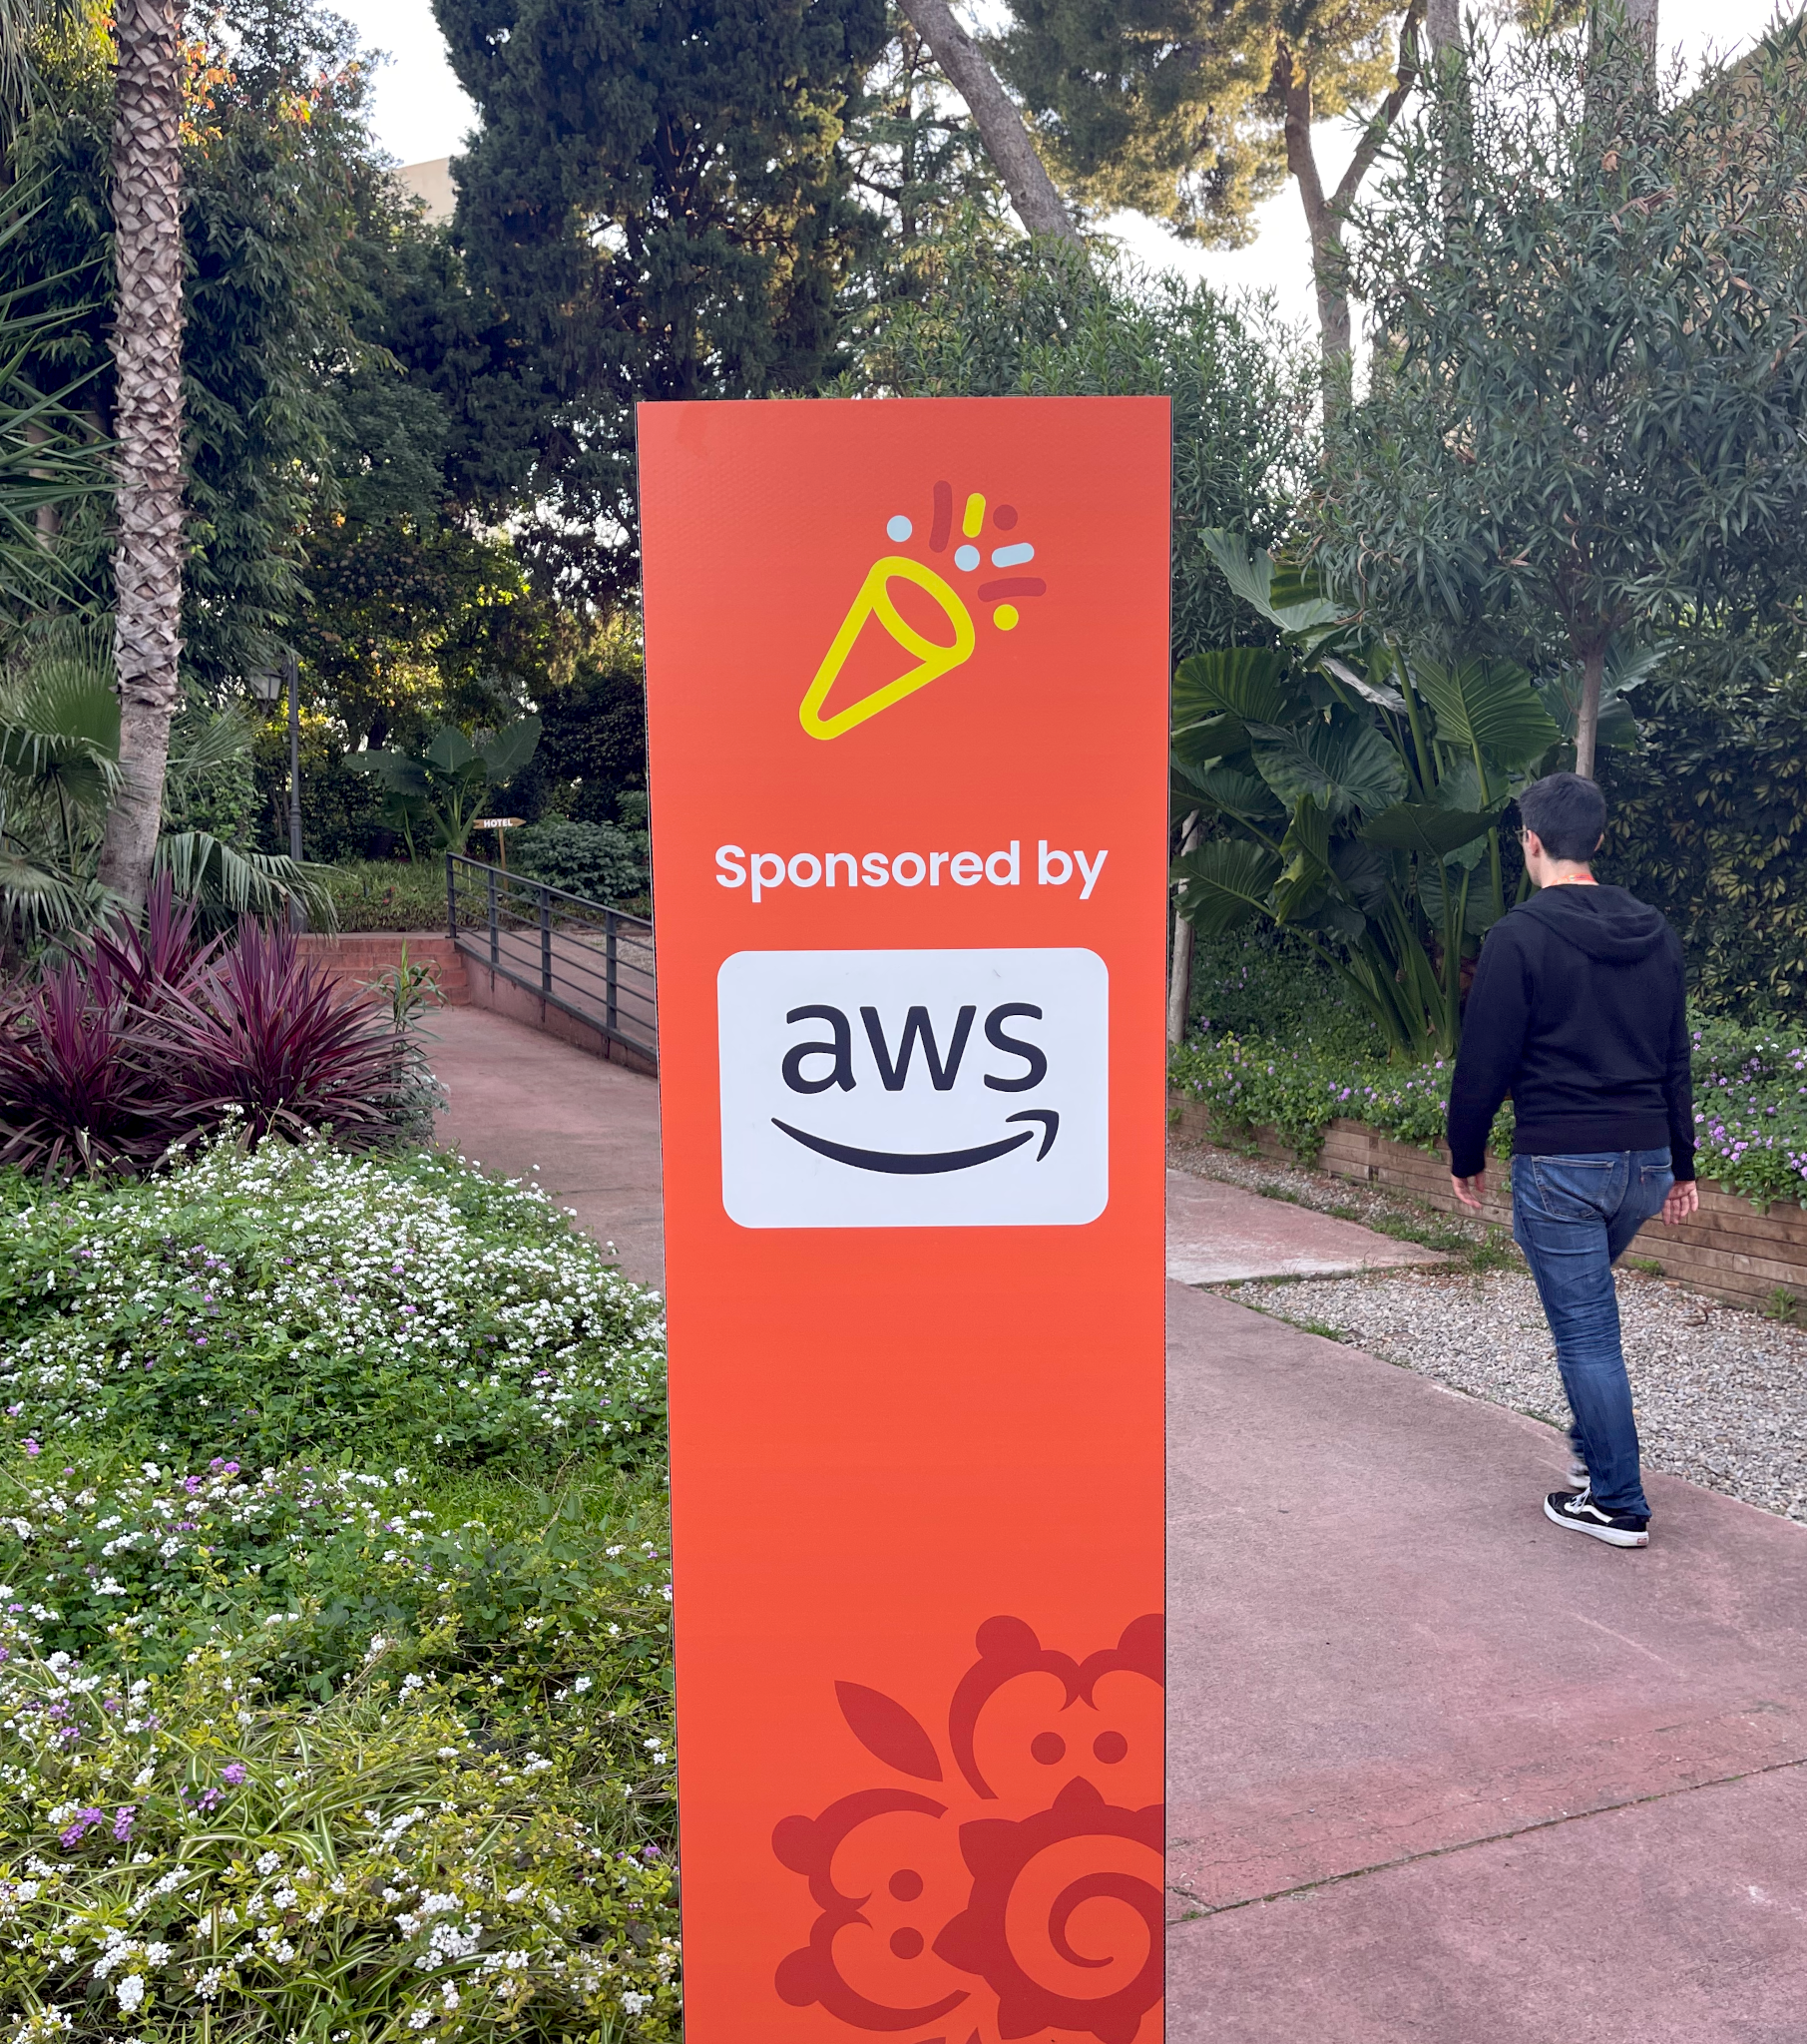
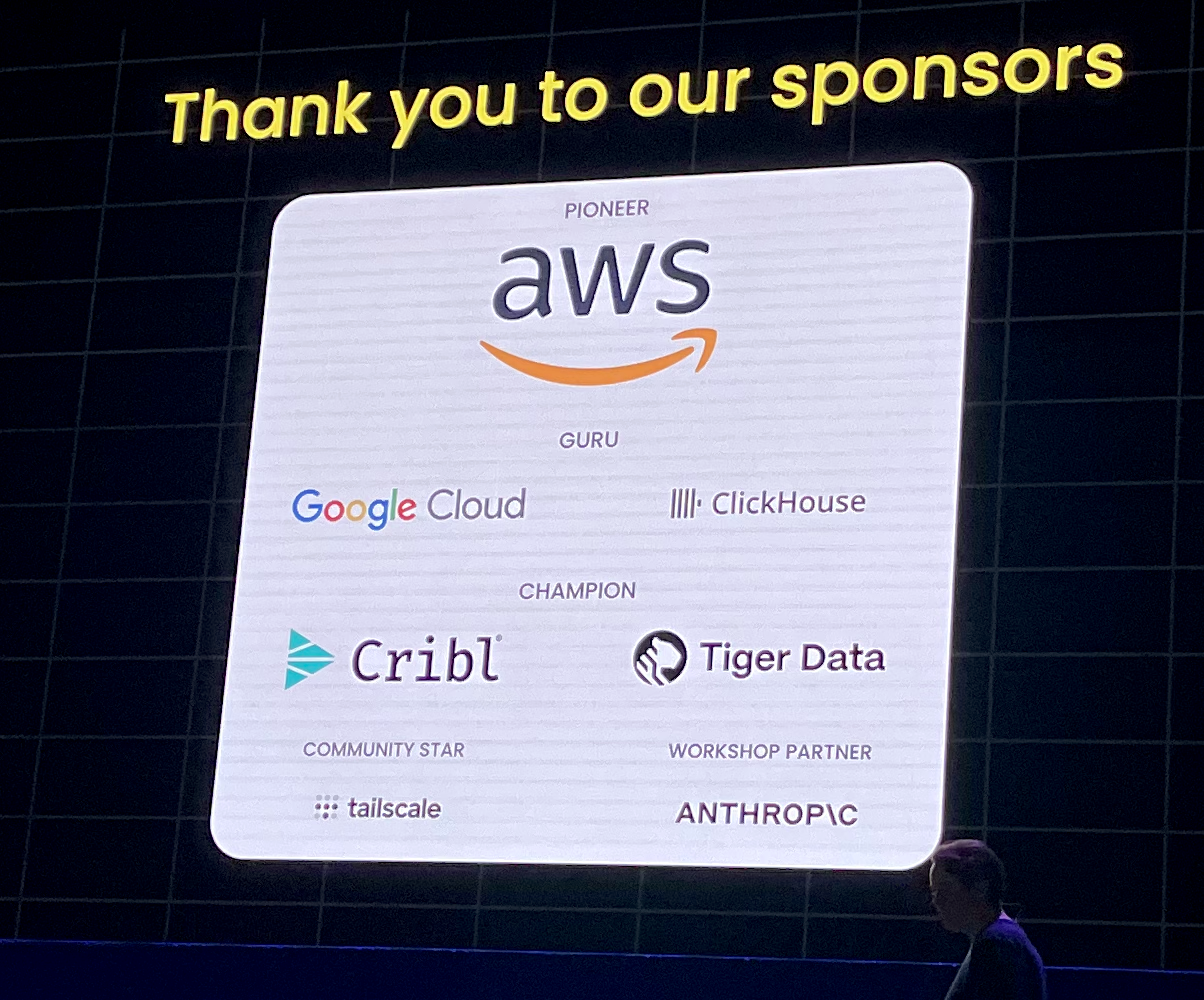
AWS was the sponsor of the conference party, and it too raised the bar on conference events. Now granted, part of it was easy since we were in Spain and having amazing food is the norm, but the combination of good food, good drink and wonderful weather created a perfect end to the day.
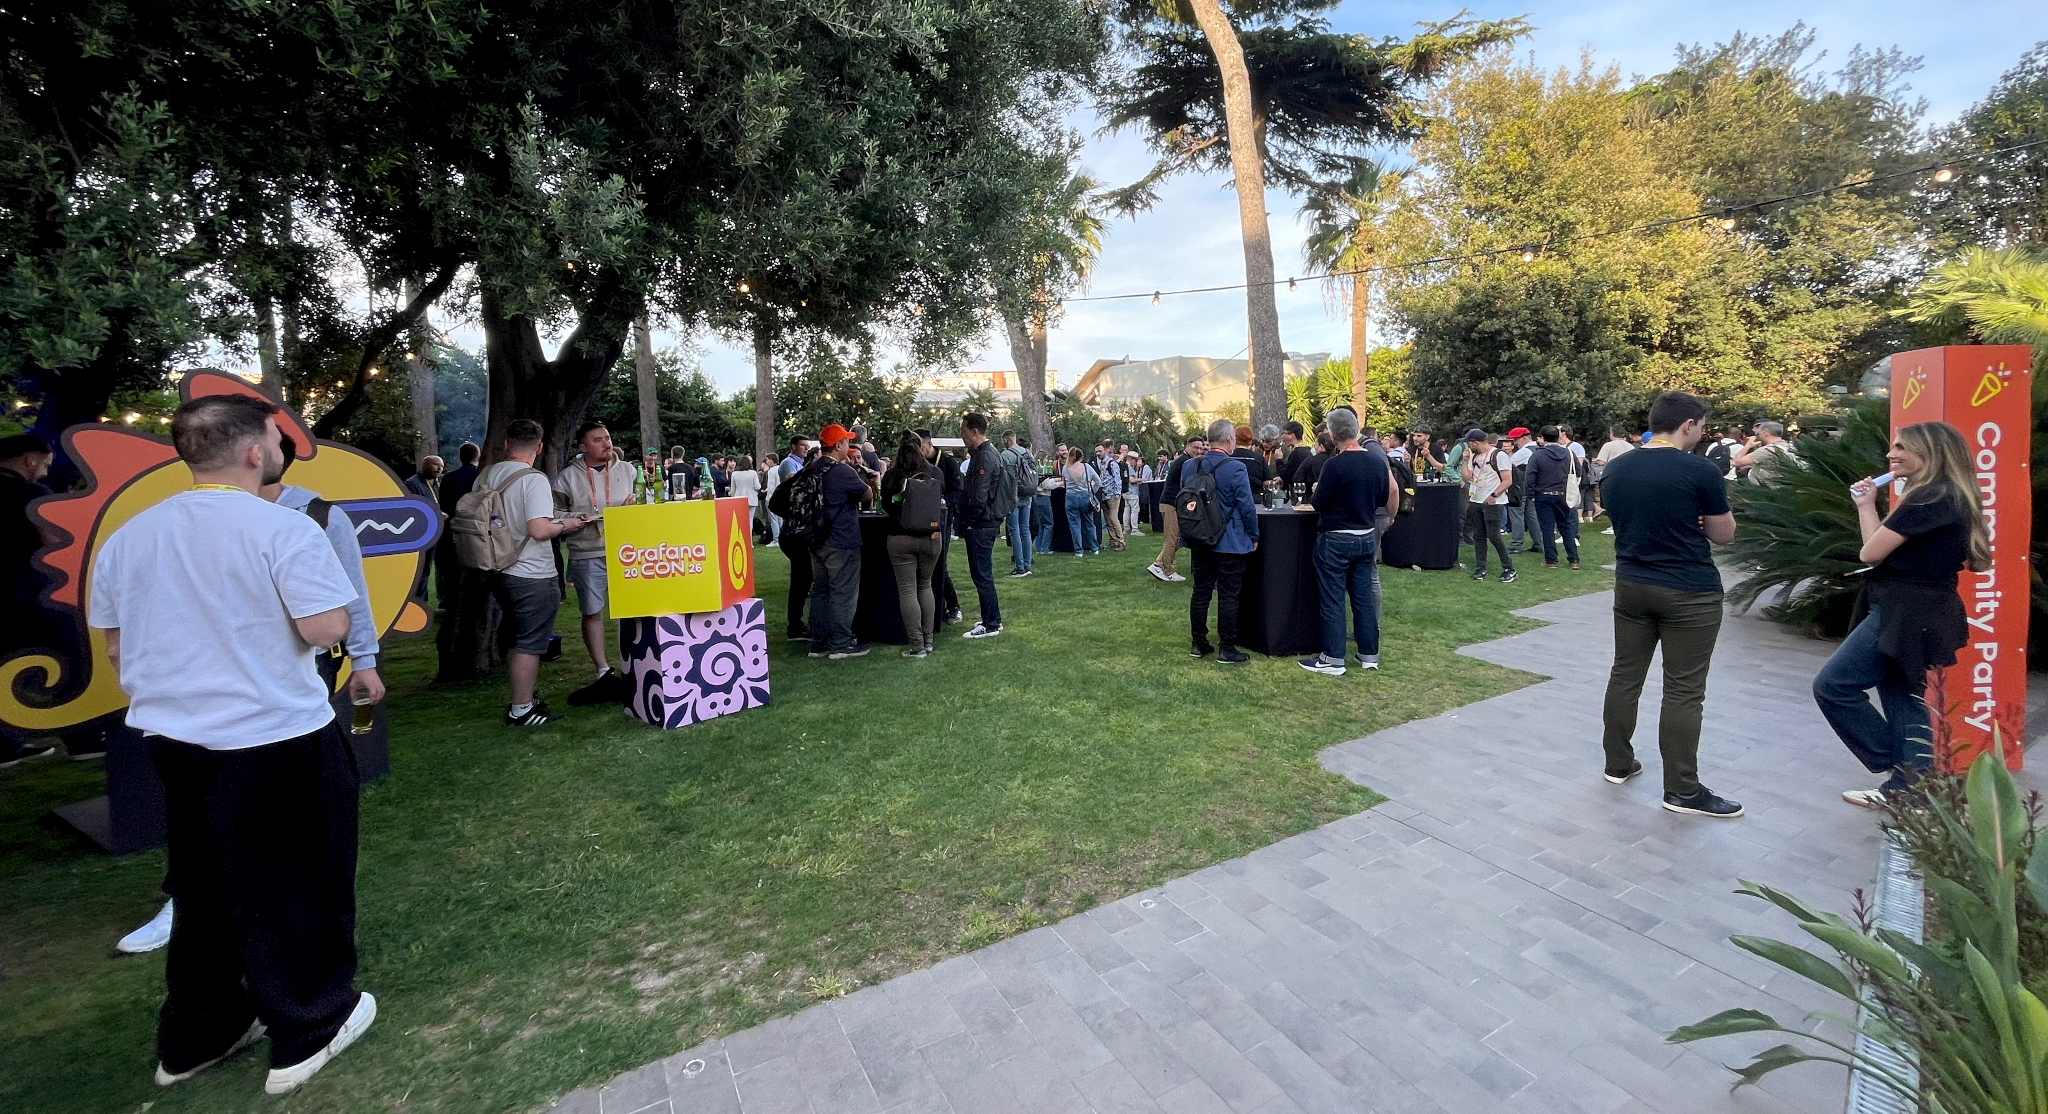
Several of my new friends were local, but even they stuck around for this party - it was that good.
Wednesday morning was kicked off by Mat Ryer, once again as MC, and the keynote focused on the newest version of Grafana: 13.
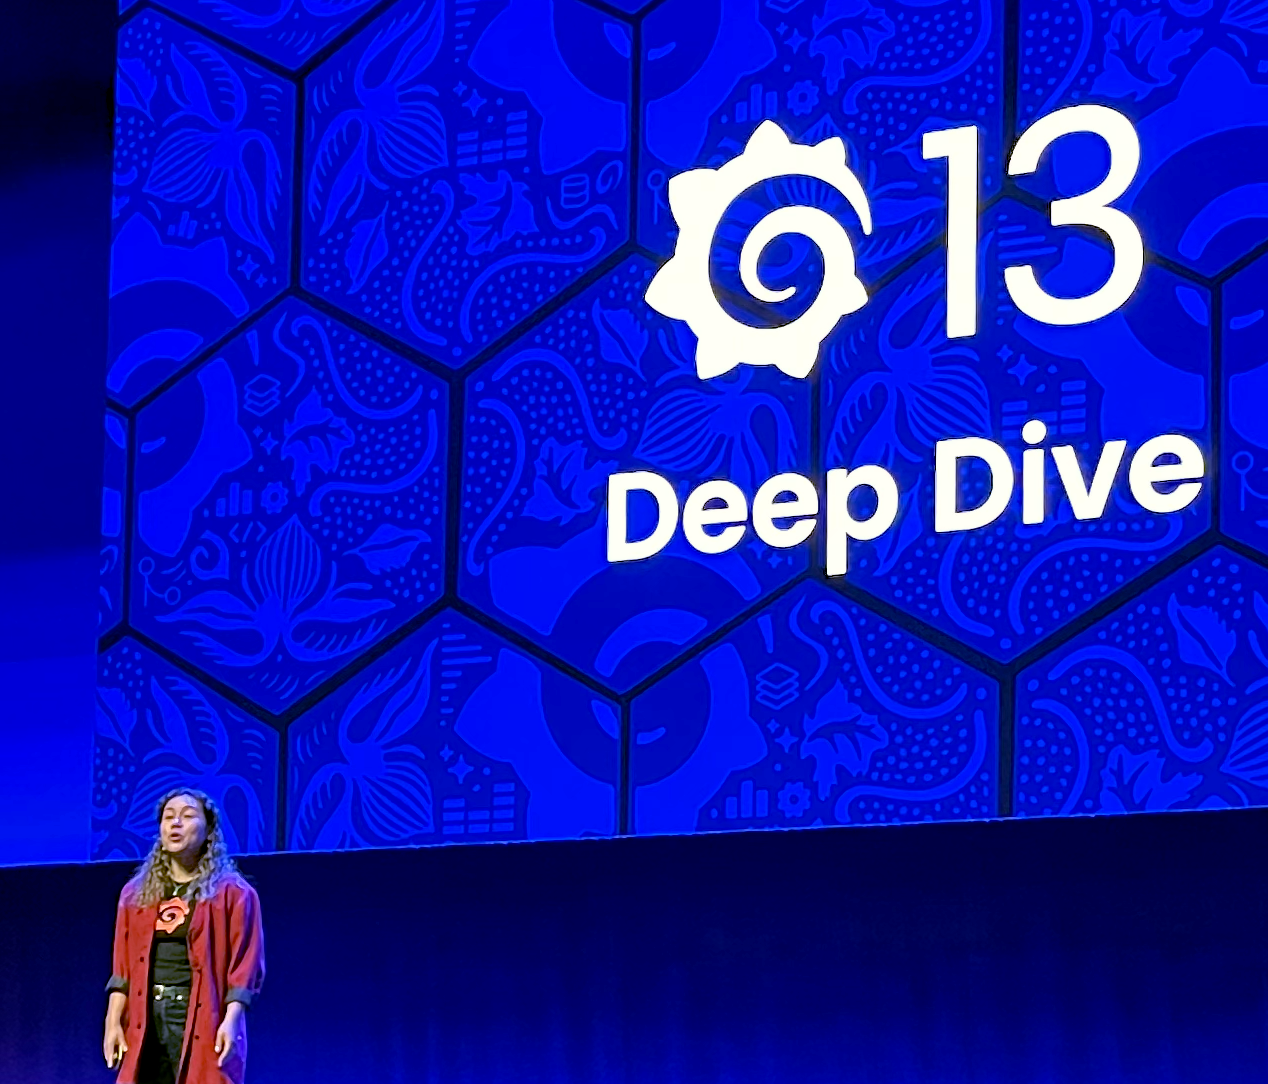
Alexa Vargas Ortega took the stage.
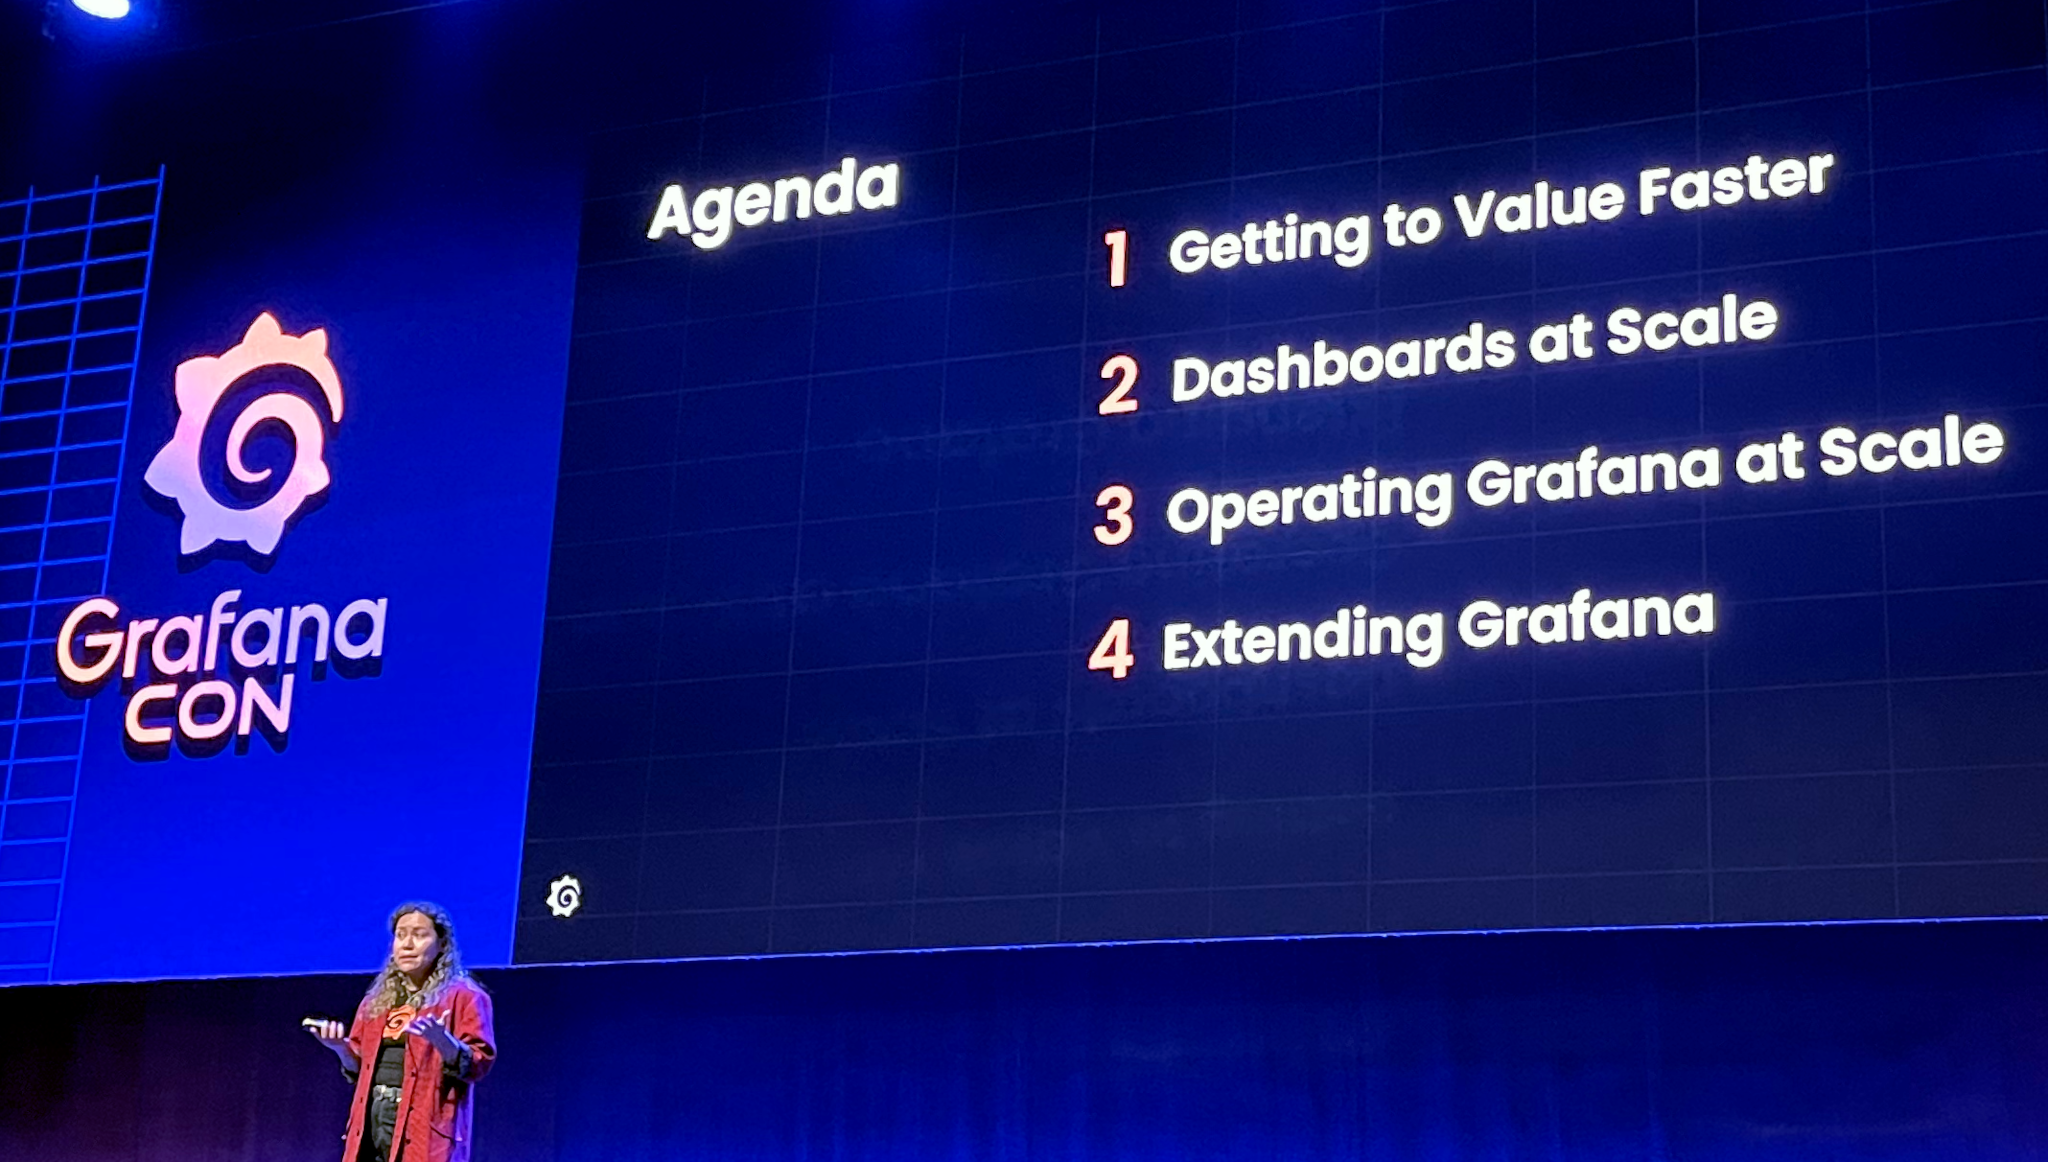
She gave us an agenda for the Version 13 discussion.
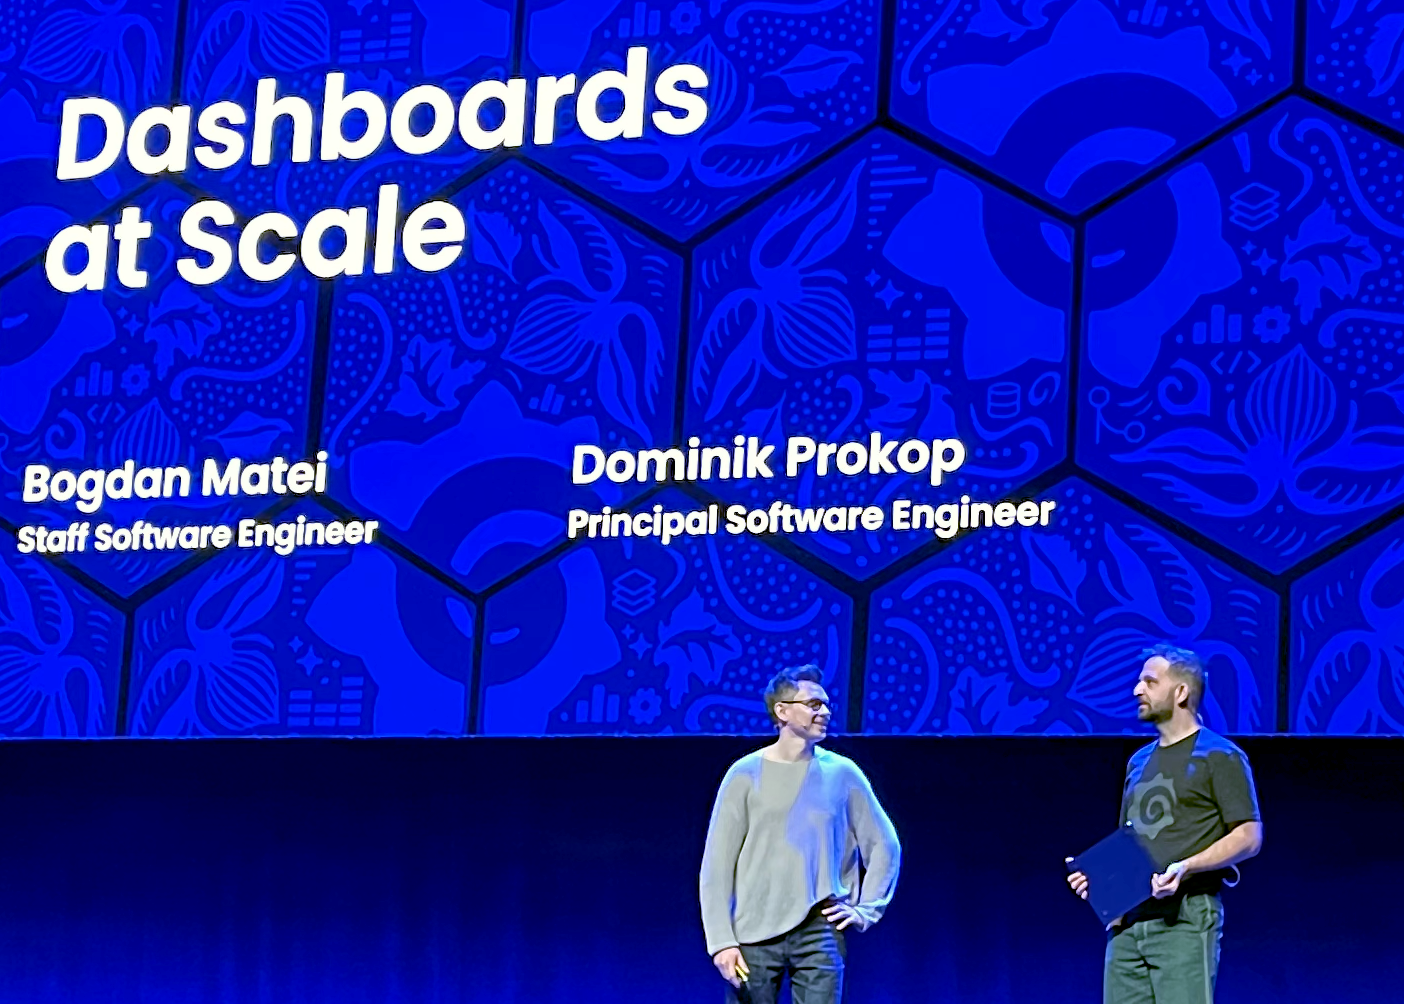
Bogdan Matei and Dominik Prokop talked about using dashboards at scale. Useful features included such things as a new versioned API (I am a huge fan of APIs everywhere) and the ability to sync and manage Grafana configurations via git. GitOps is a thing, especially at scale, and I’m certain this will be a welcome feature.
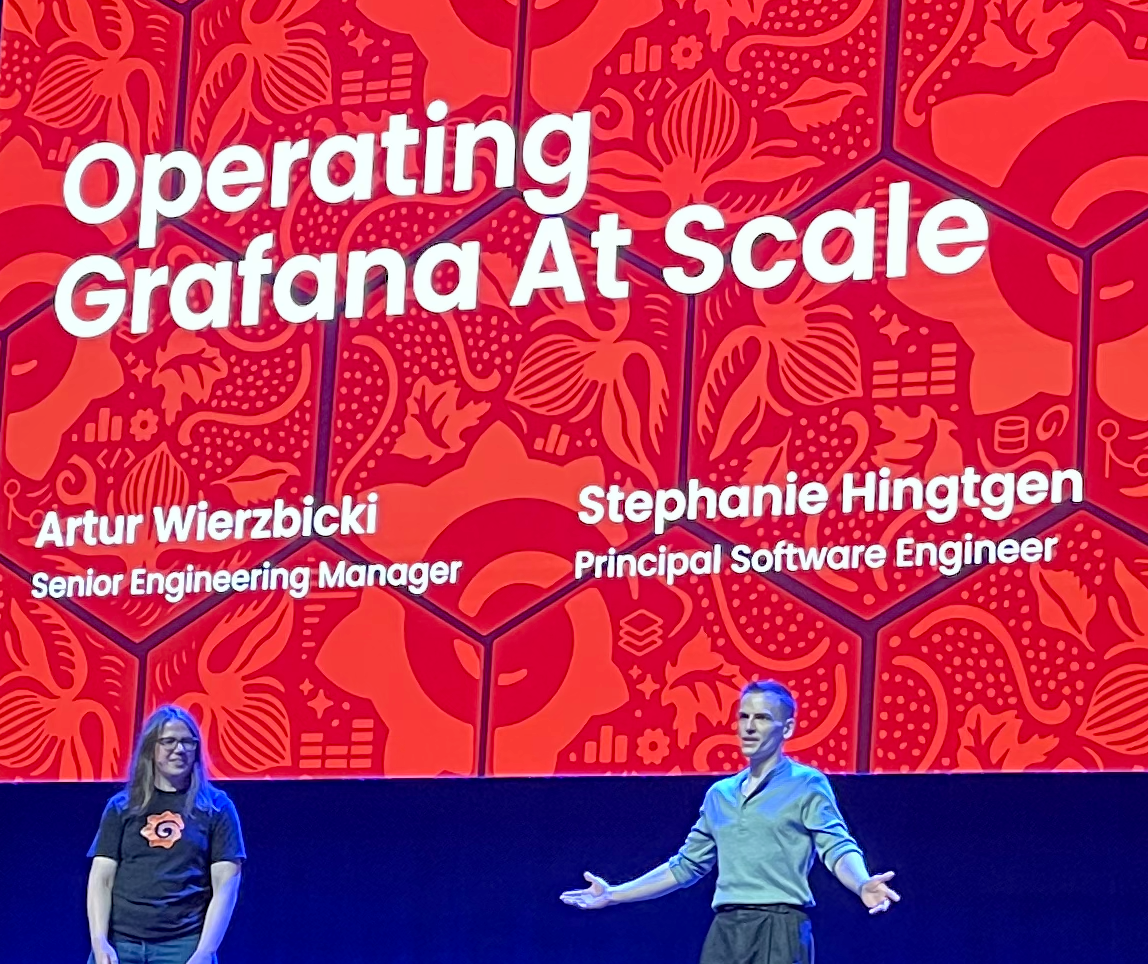
Artur Wierzbicki and Stephanie Hingtgen talked about improvements in operating Grafana at scale.
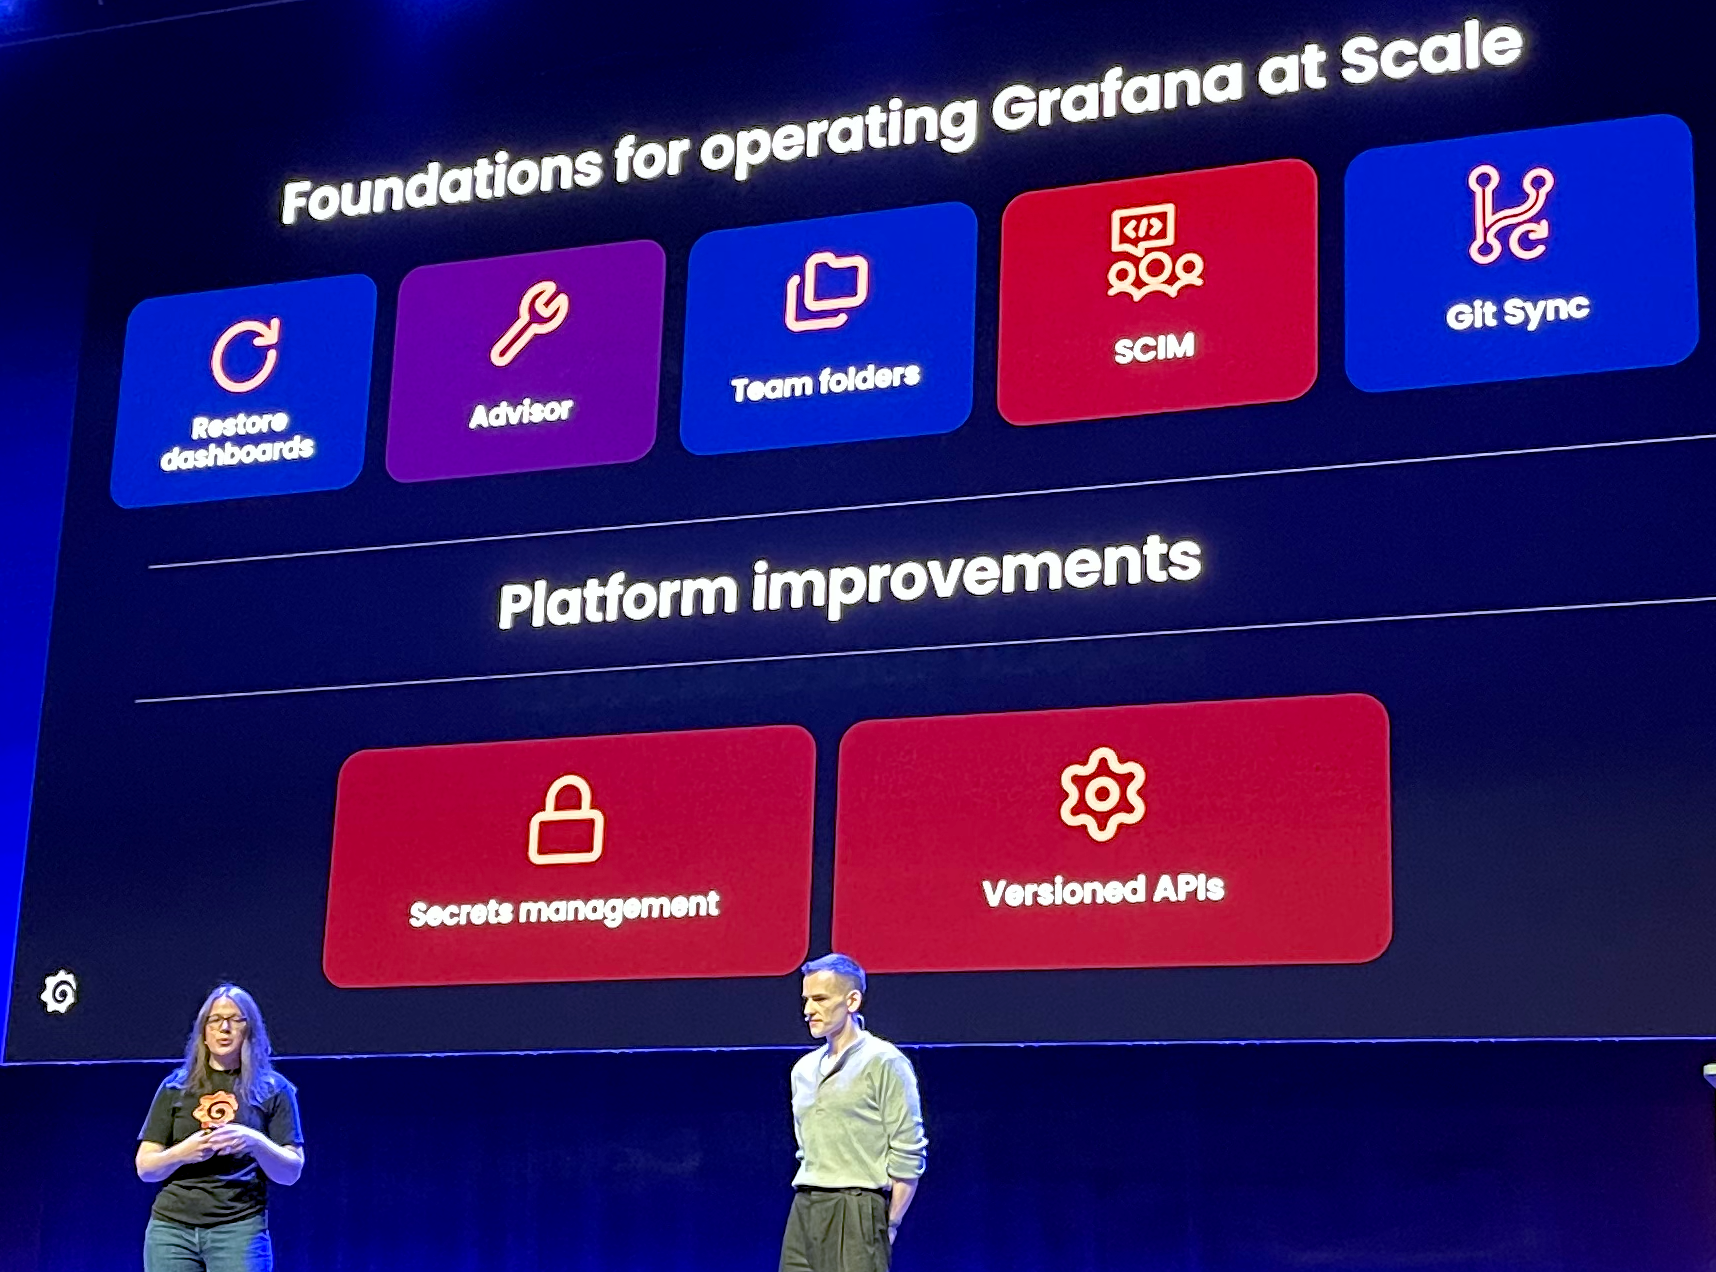
This included Advisor, a tool that can check your installation for problems, such as a failing datasource, and help correct them before users notice.
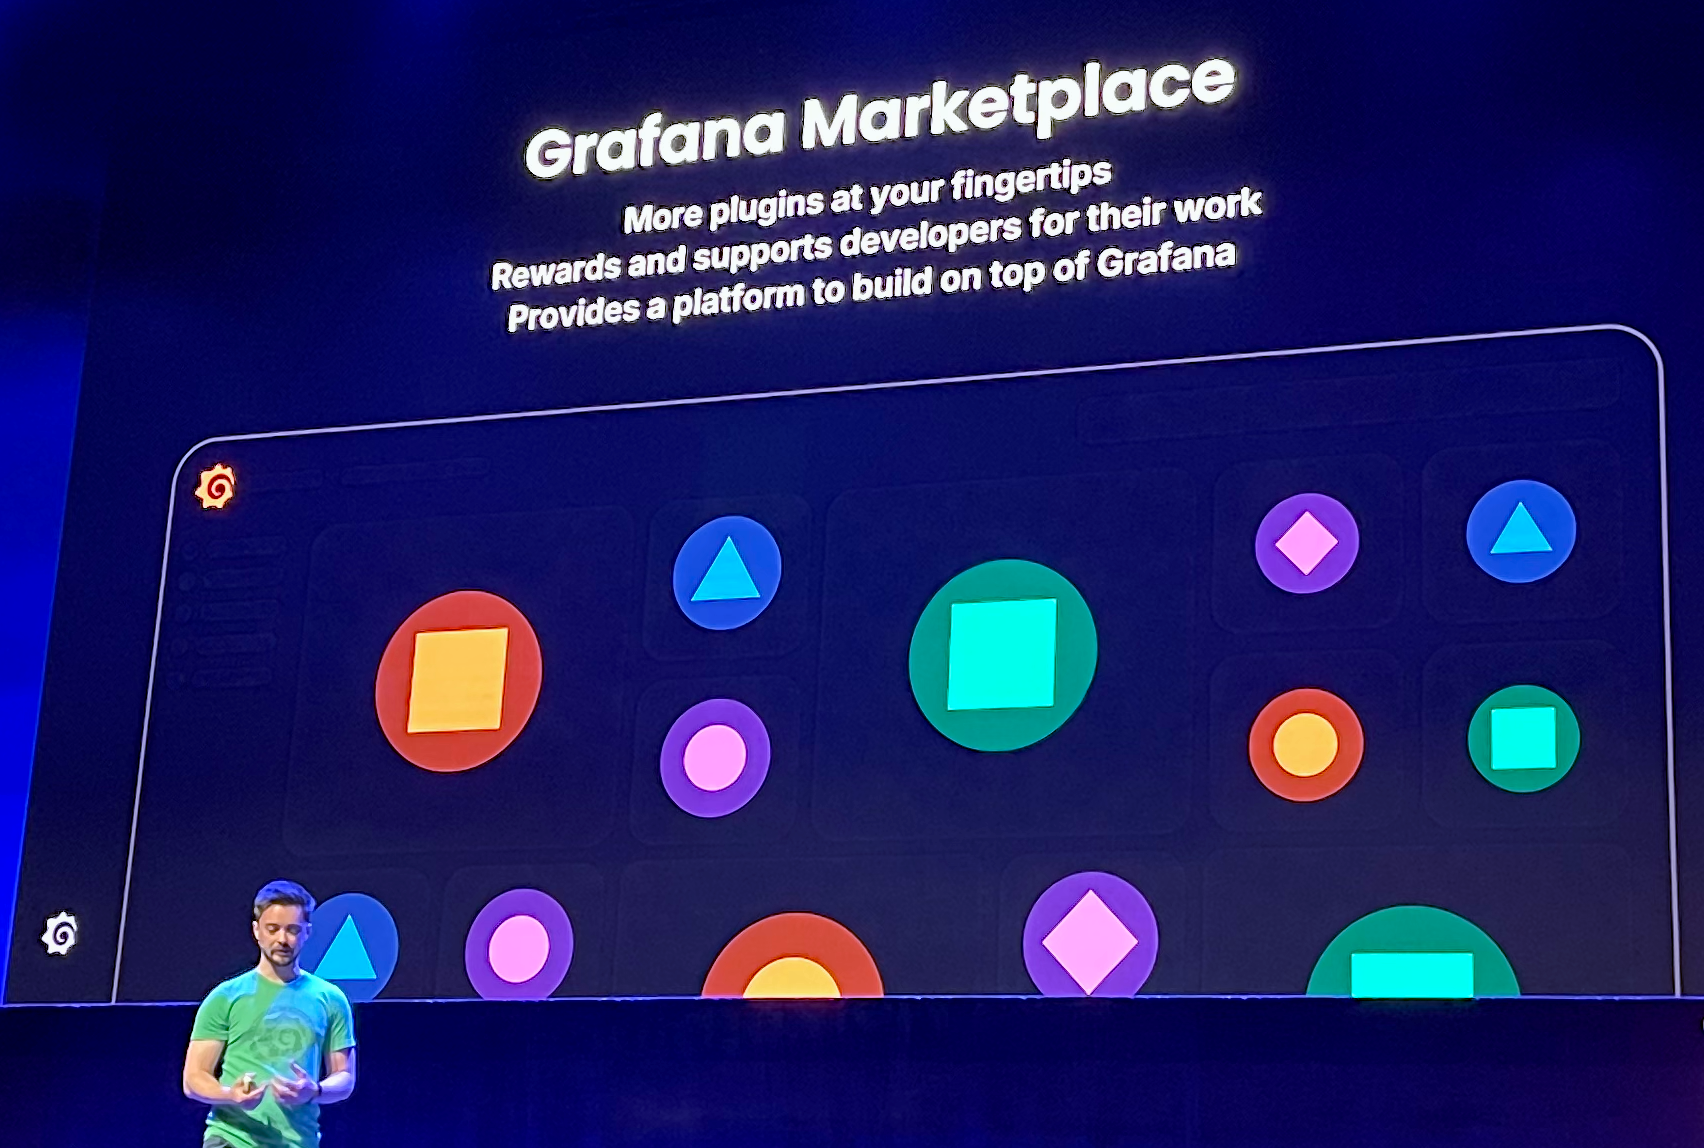
The final part of the first session was Grafana Marketplace. When I talk to founders about commercializing open source, I strongly recommend the creation of a way to extend their product through third parties in the form of a marketplace. A number of companies, such as Wordpress, have been quite successful at this, and it was nice to see it come to Grafana. Not only does it make your product more powerful, it enables builders to add value to your platform and, should they so choose, get paid for it.
There is a lot of good stuff in Grafana 13, and if you are not using Grafana Cloud it should be a productive upgrade (Cloud uses rolling releases so you can try out most of these features now).
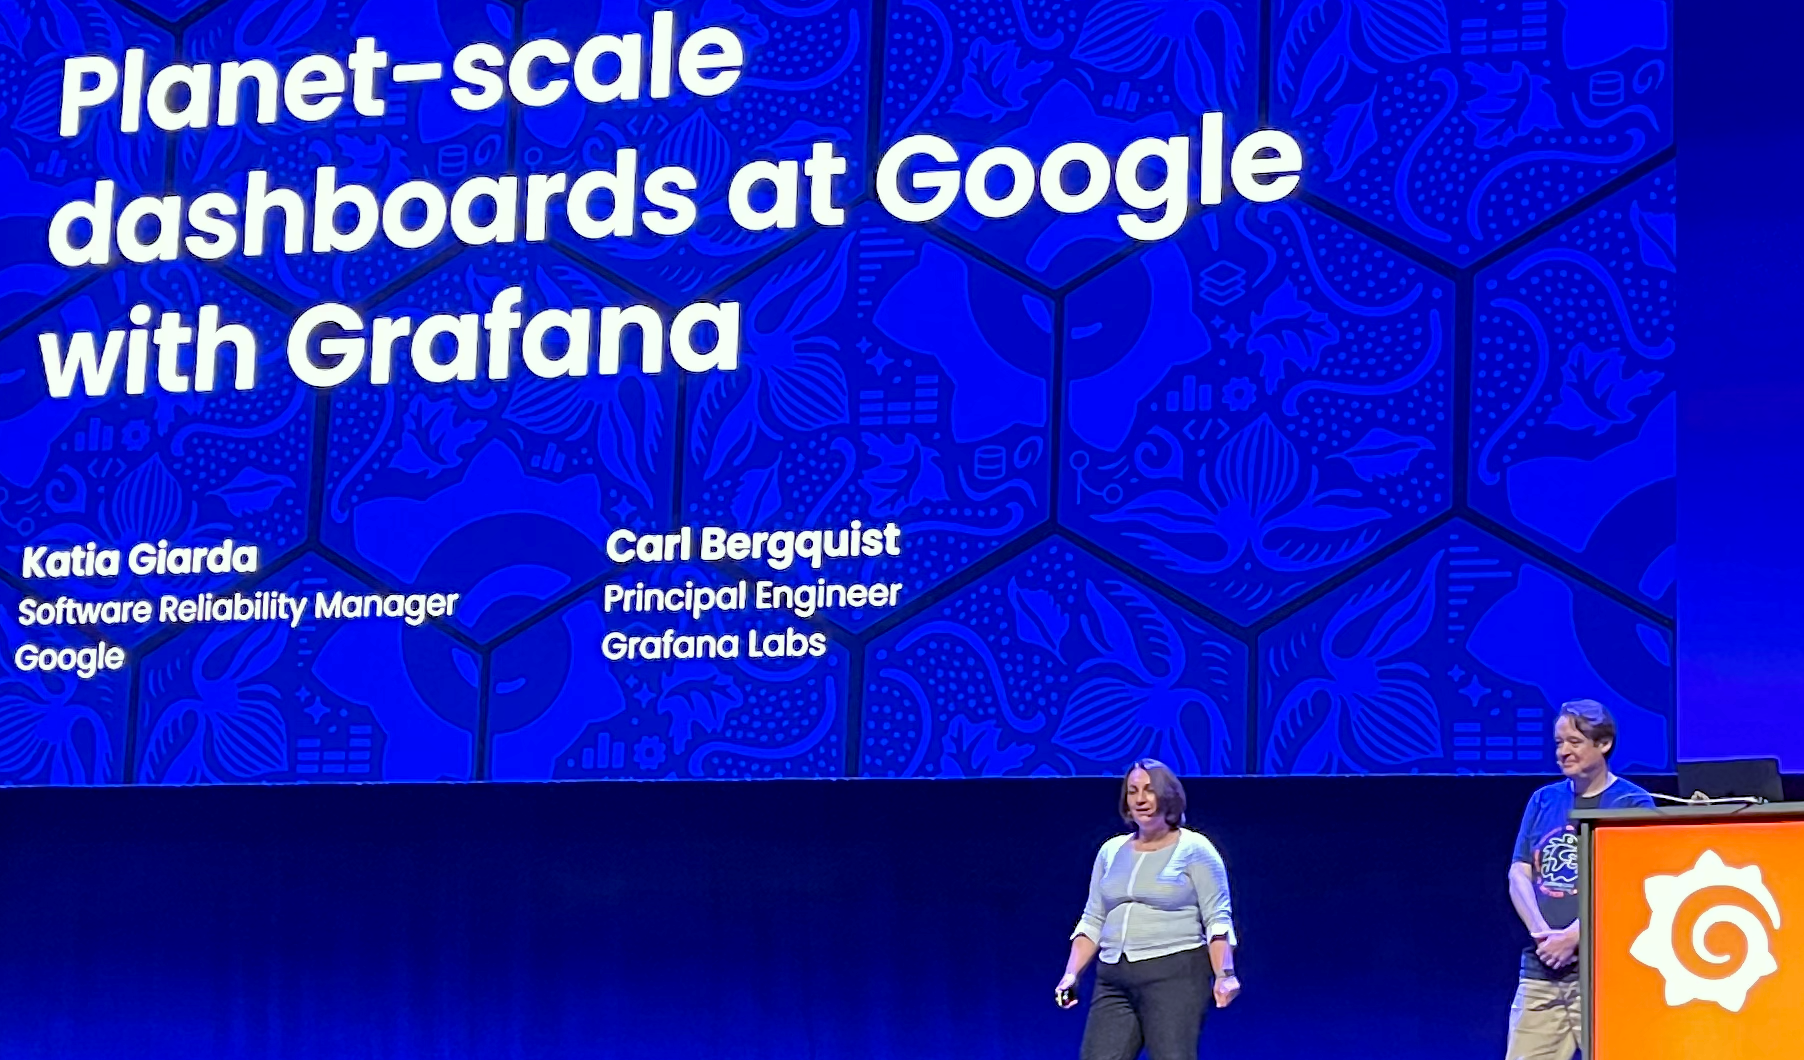
Much like the presentation by the folks from LEGO, I was eager to see the presentation by Katia Giarda and Carl Bergquist on Grafana use at Google.
There were a couple of good takeaways here. One is to create observability solutions that let you zoom in on what is relevant, and second to create dashboards that are reusable across multiple situations.
Then it was time for lunch, but I almost missed it because I was having too many cool conversations in the Expo Hall. I joked in my summary that I didn’t get my choice of meal, by the time I got downstairs only veggie boxes were left and there were no more sodas. It was still really good.
During this break I also got to meet Scott Fingerhut (Grafana CMO) and while I was back in the green room Shanna Gregory got me a plush Grot! (#winning).
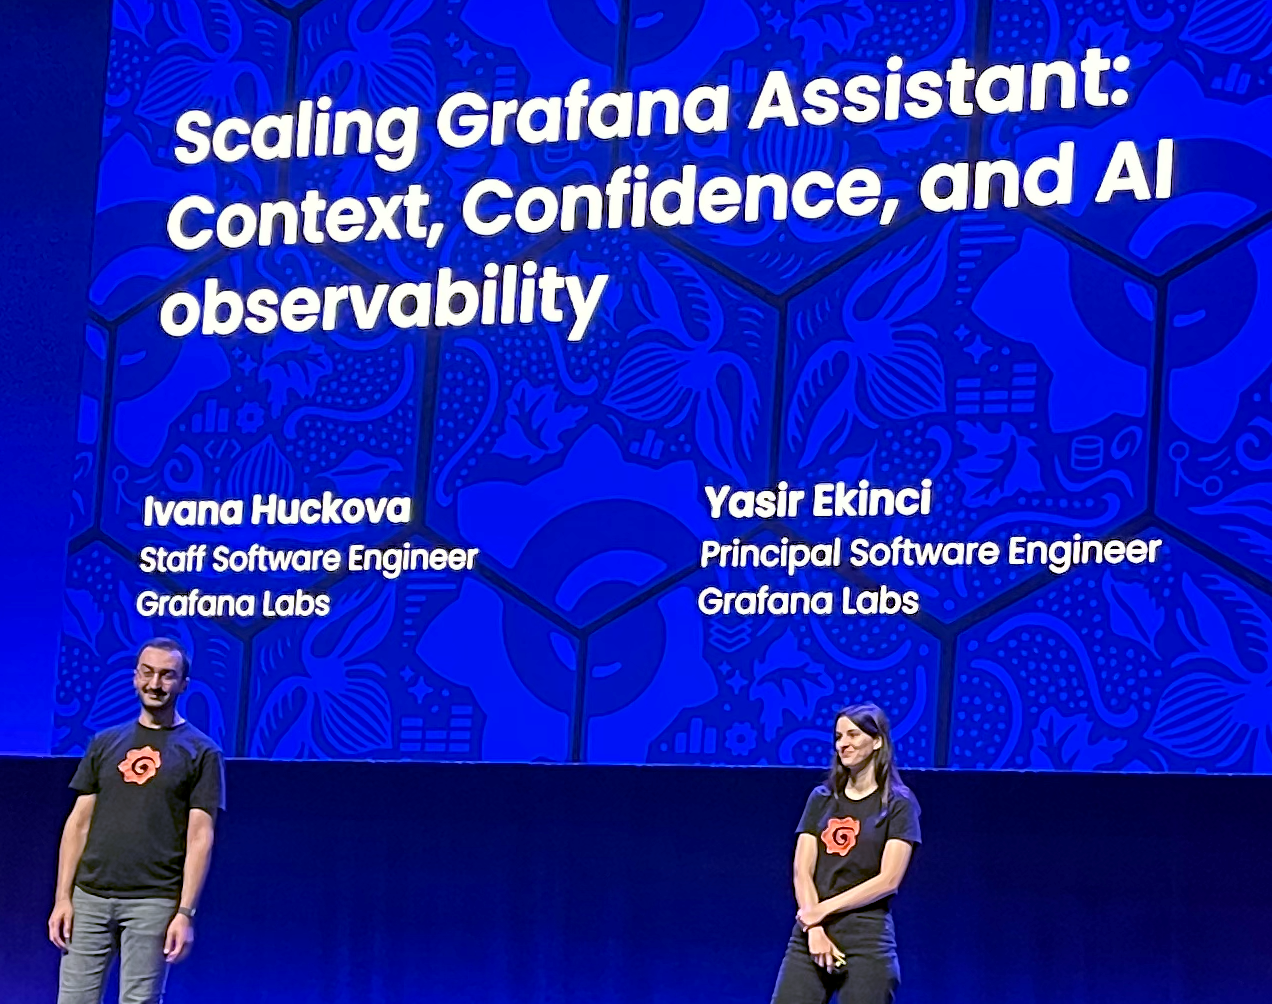
In the first session after lunch, Ivana Huckova and Yasir Ekinci talked about building the Grafana Assistant AI agent, especially the issues with maintaining context.
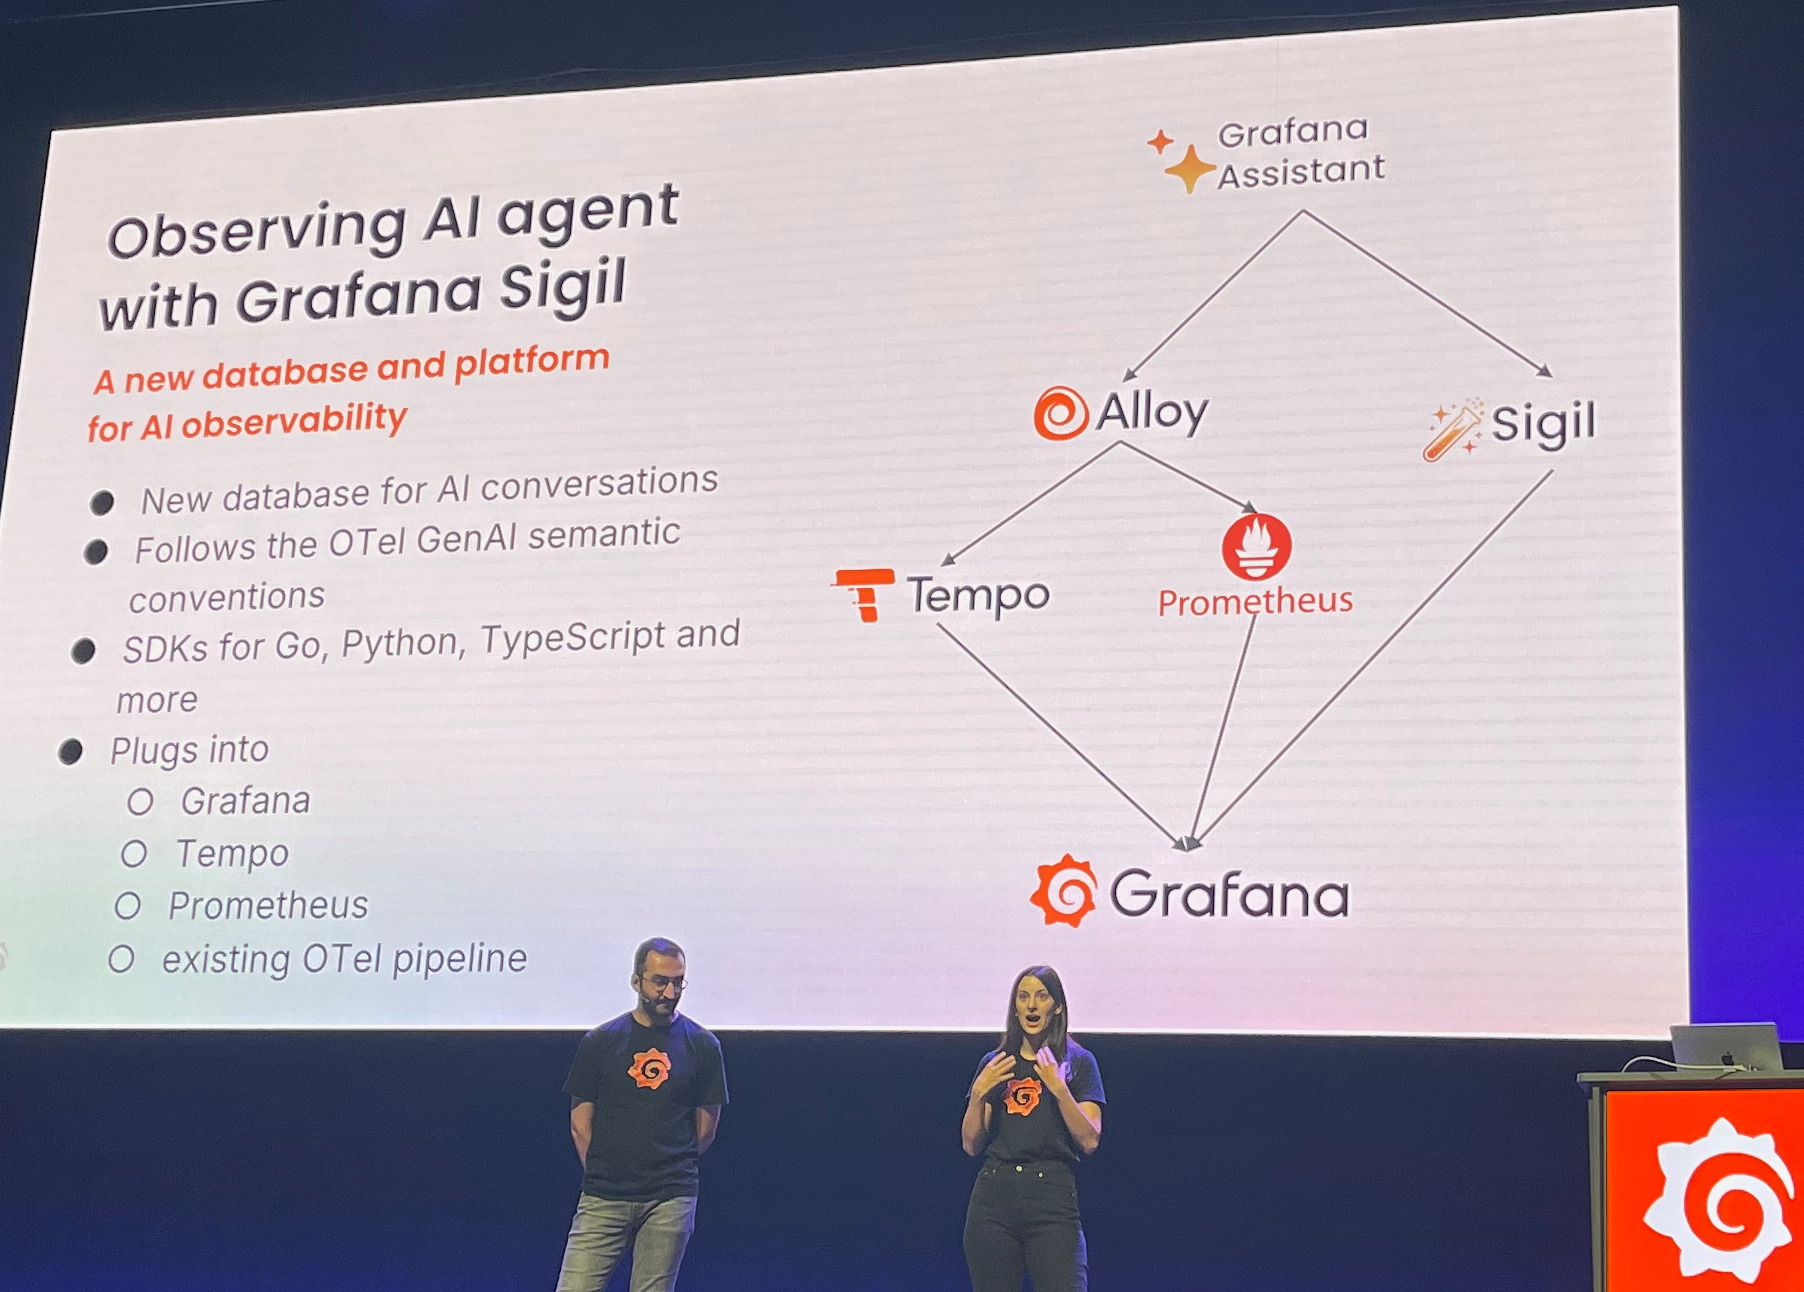
They also introduced me to Grafana Sigil, which is a new platform for AI observability. When consumption-based AI billing becomes the norm, having AI observability will be a requirement for every enterprise using the technology. It will pay for itself in reduced costs.
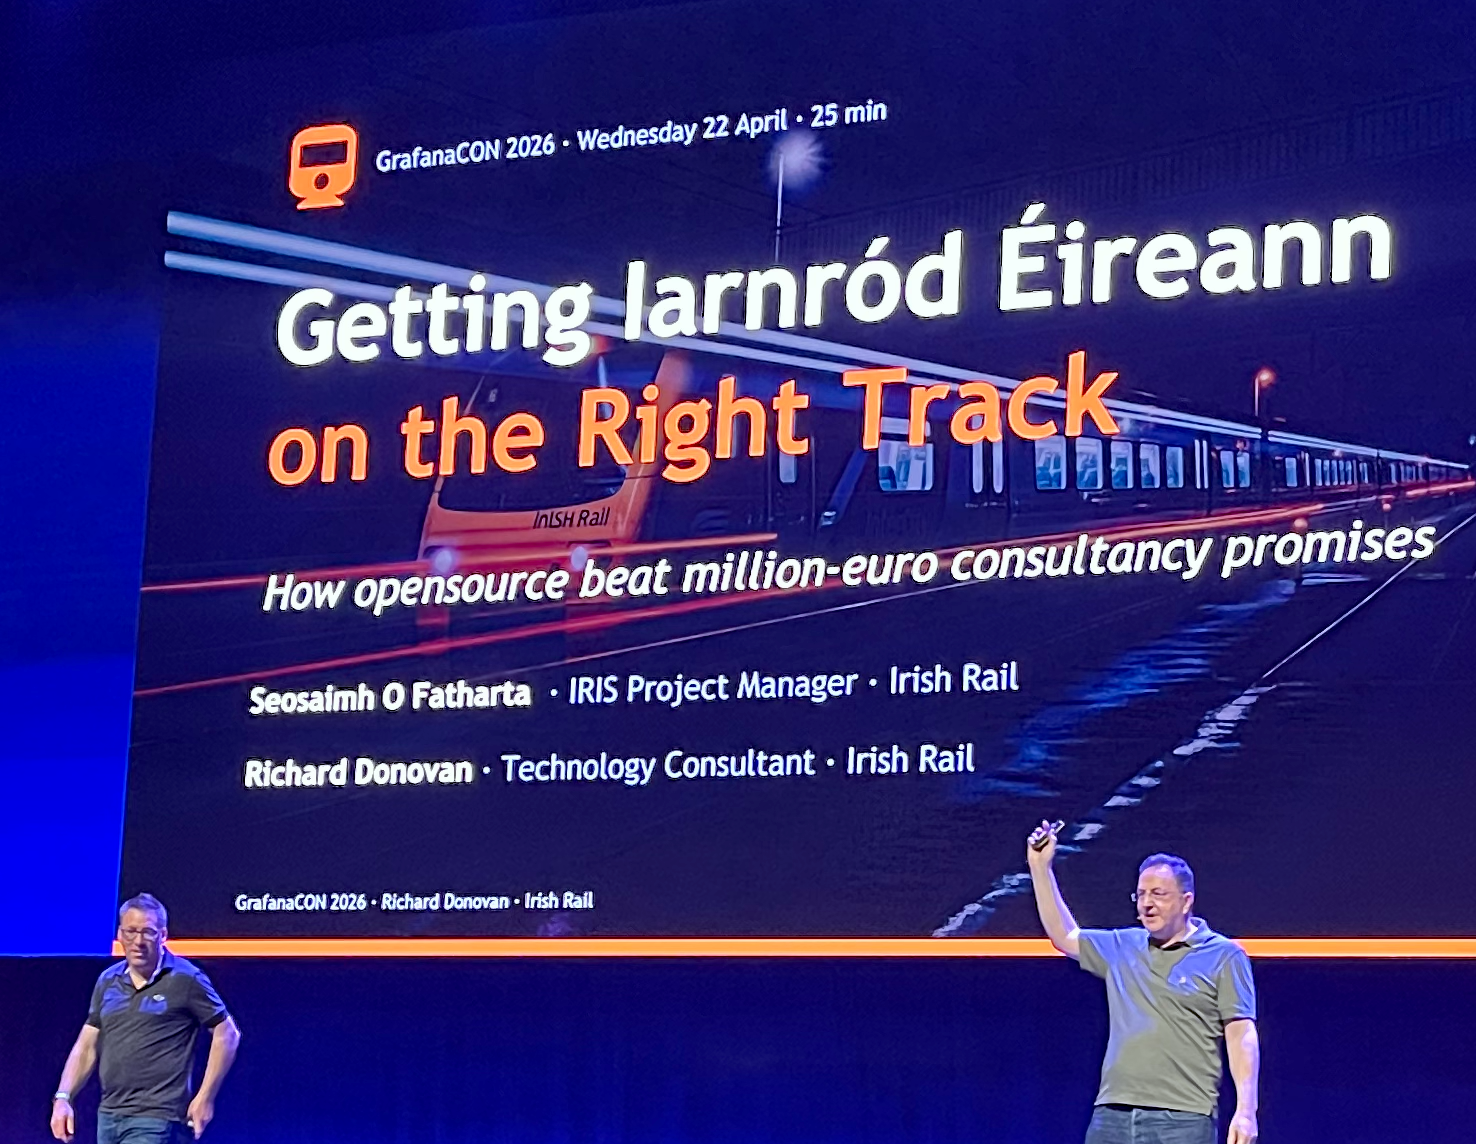
I really enjoyed the next presentation from Iarnród Éireann (Irish Rail) given by Seosaimh Ó Fátharta and Richard Donovan.
As an American I have little experience with trains, but I rarely pass up a chance to ride in one when I travel outside the country. This session talked about how the railway solved maintenance issues by deploying commodity sensors with MQTT support and bringing them together using Grafana. If a piece of rail is overheating, an engineer can be dispatched to investigate before the issue impacted rail service.
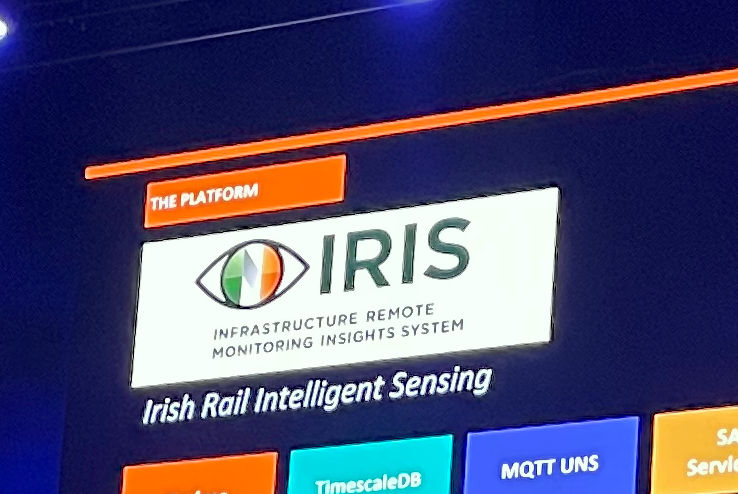
They also called their product IRIS (Infrastructure Remote-Monitoring Insights System). I had to chuckle at that because Oculan, the company that started OpenNMS, used optical-themed product names. If memory serves, the Iris was an agent, whereas the Eyelid was a security appliance and OpenNMS itself was the “Optic Nerve”.
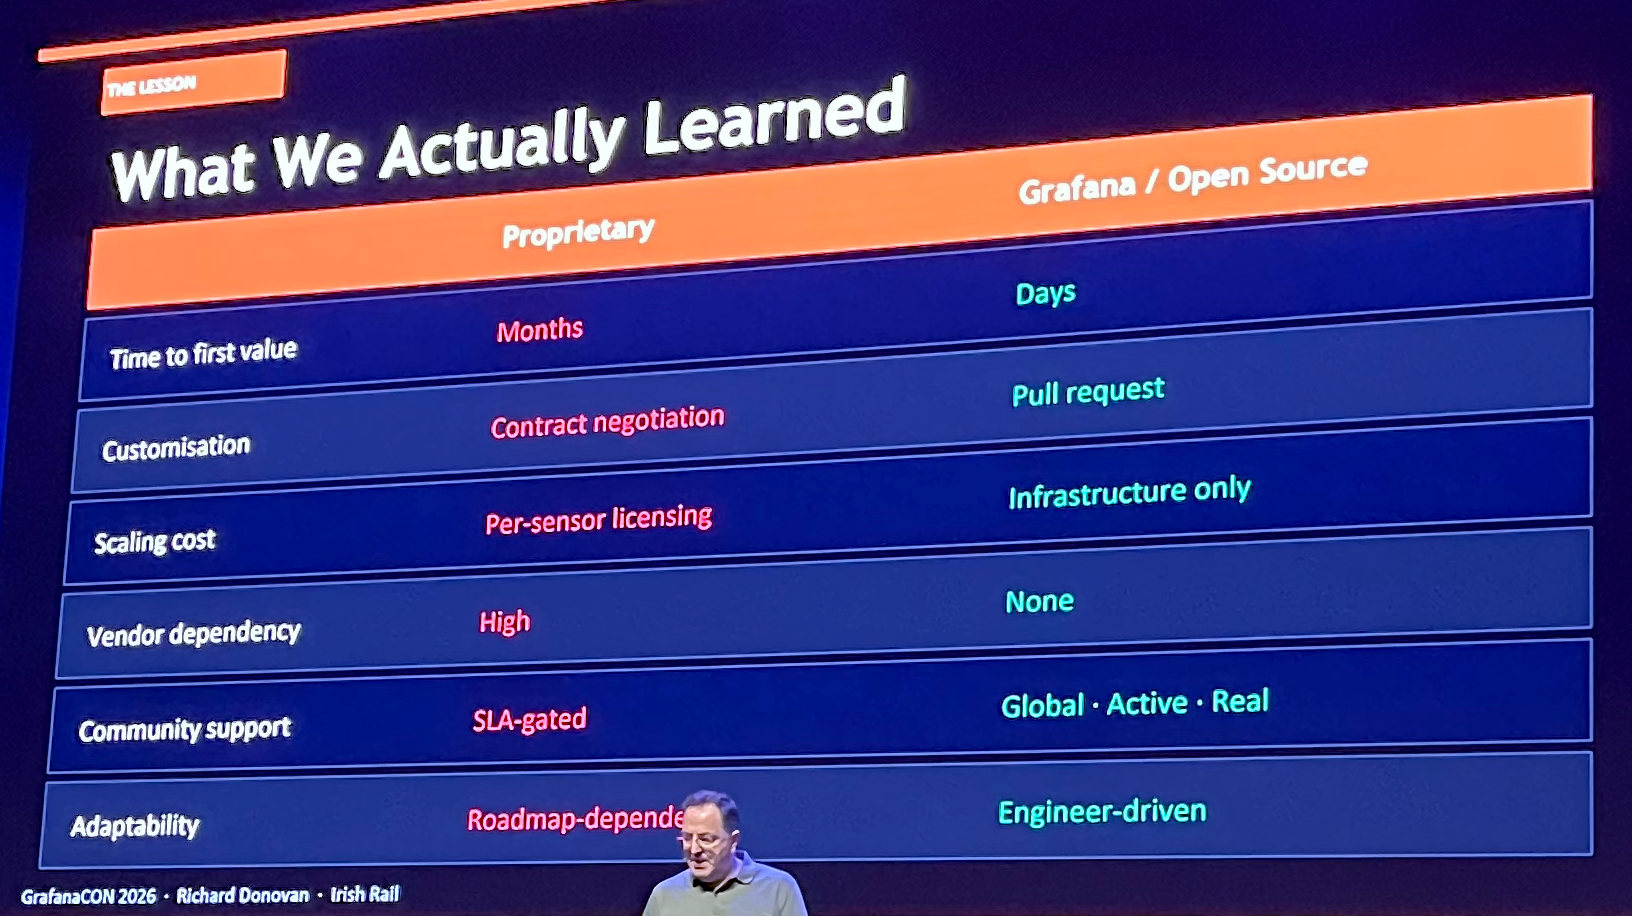
The lessons they learned about proprietary vs. open source could easily be applied to other industries.
Another reason I like Grafana is that there are a lot of parallels between it and OpenNMS. OpenNMS was one of the first monitoring platforms to include an alerting system (called “notifications”) whereas Grafana has Grafana Alerting.
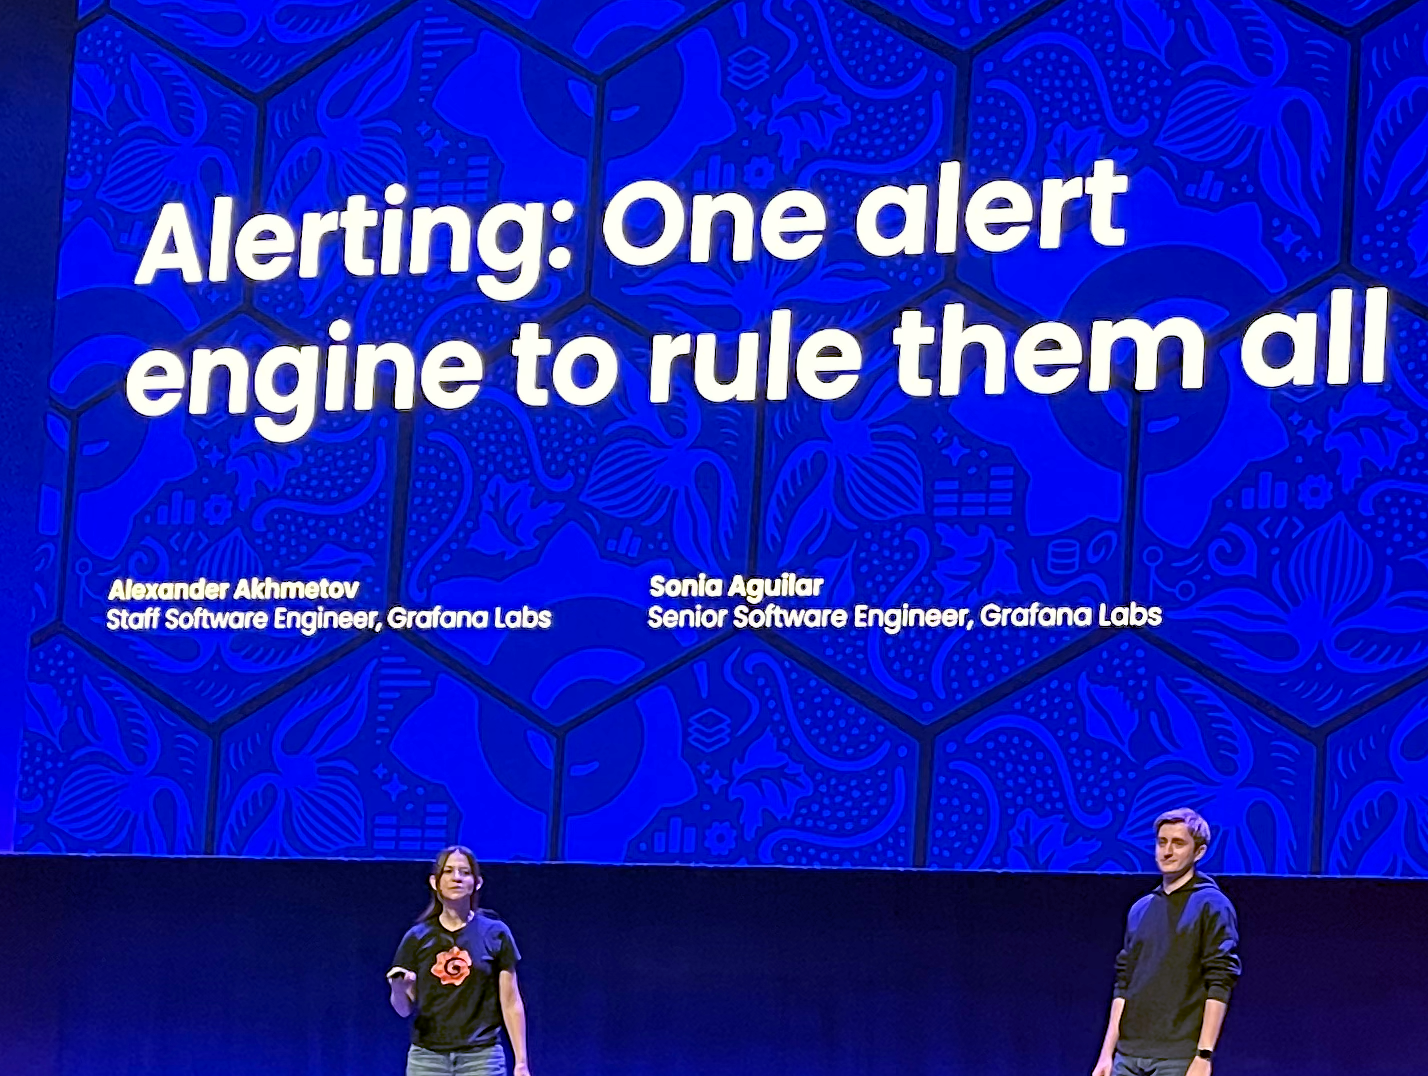
Alexander Akhmetov and Sonia Aguilar gave an update on this part of the platform. There is a reason that “help desk ticketing” was and still is a product in and of itself. It can get complex, but many users don’t need the expense and hassle of a full blown system. However, they still need to get notified when things happen on the network. This talk highlighted a number of new features as this important part of the Grafana observability workflow keeps growing.
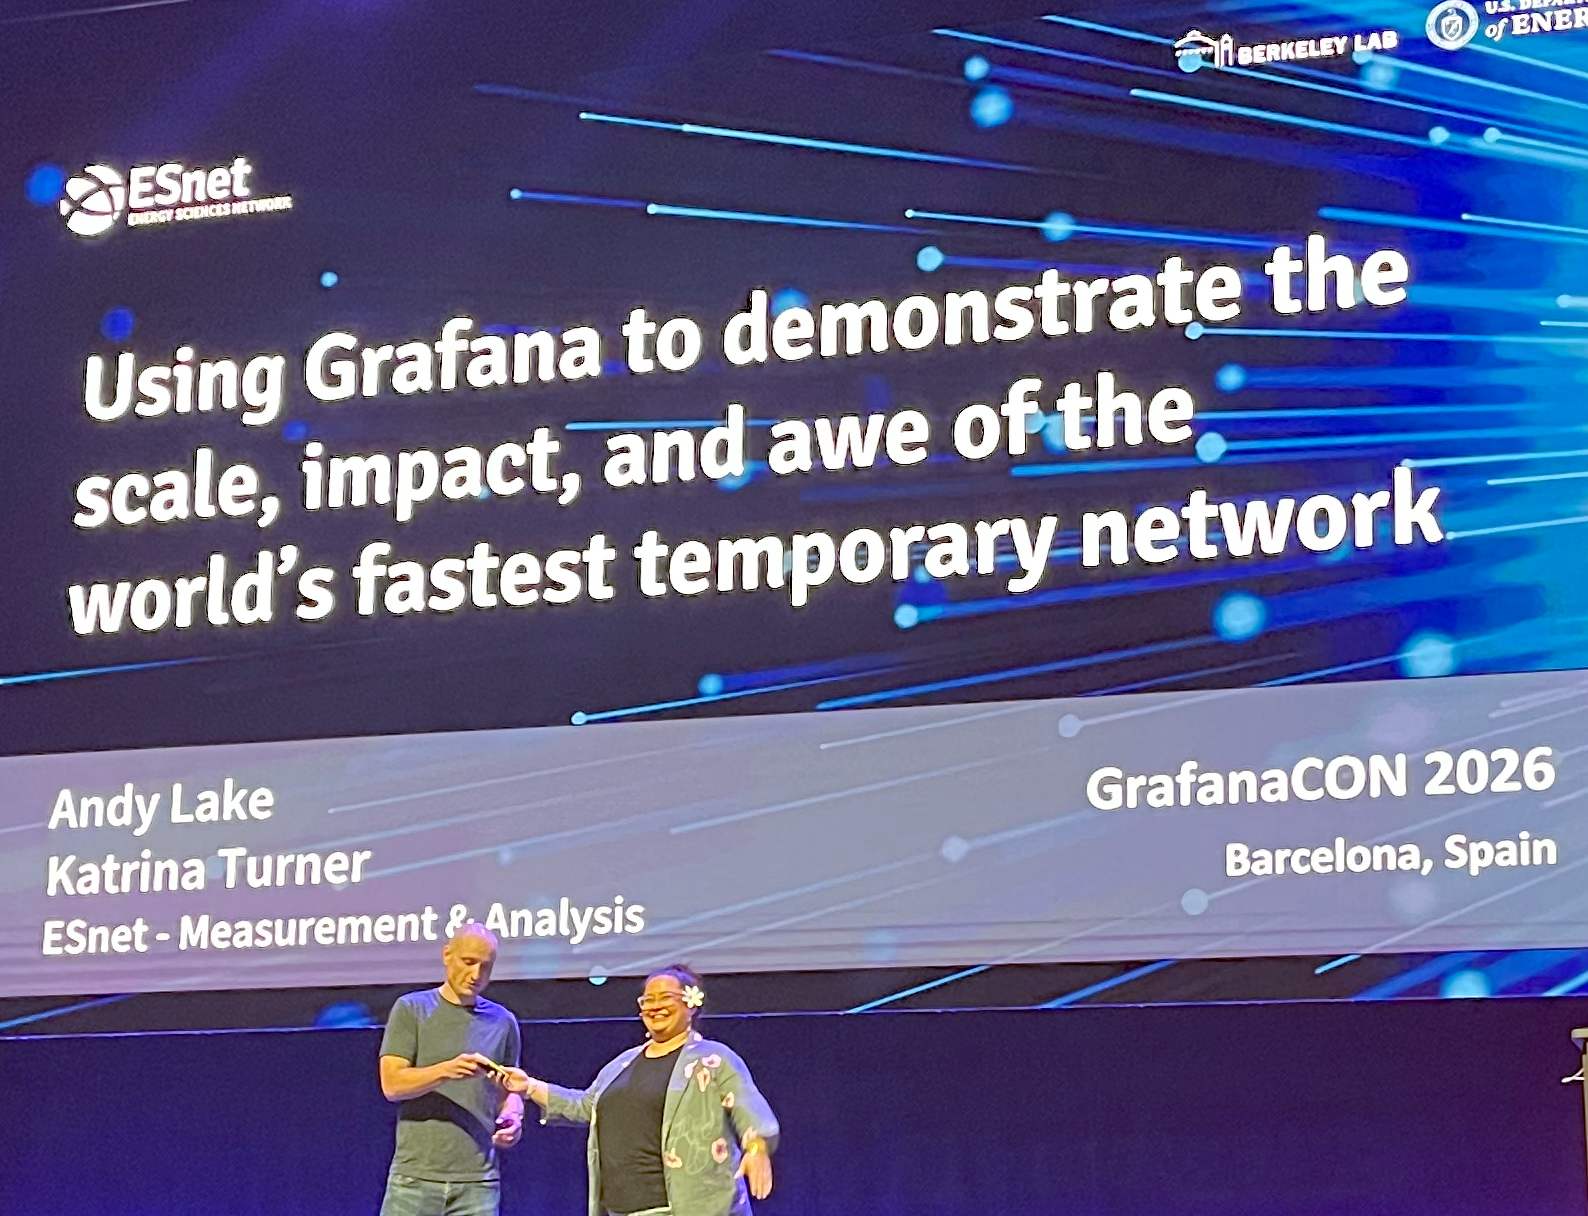
The next session was run by Andy Lake and Katrina Turner about building and then tearing down one of the world’s fastest networks. Every year there is a supercomputing conference, known as SC, that showcases high performance computing. And each year the network needs on the Expo floor grow. It takes a year to plan, a month to build, and a day to tear down the network (known as SCinet) each year. This presentation showcases real-world uses for custom dashboards to make sure SCinet ran smoothly and provided the required bandwidth to make the show a success.
We complain a lot about conference WiFi so maybe I need to go to this show just to try it out (note that I’m not sure that attendees get to use SCinet but one can hope).
The final day of GrafanaCon ended with a series of short ten-minute presentations, similar to Tuesday.
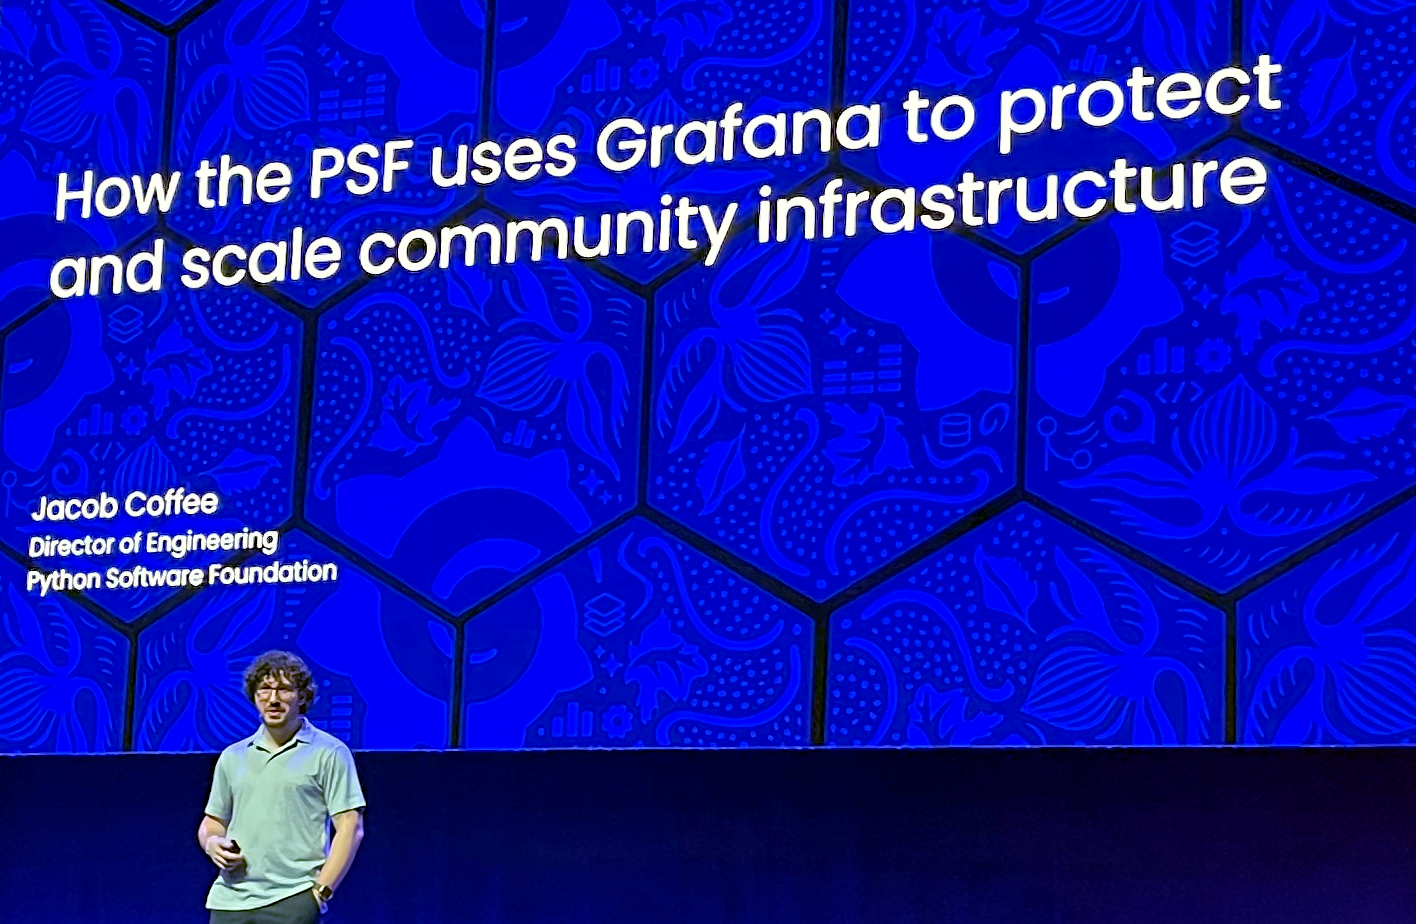
The first one was by Jacob Coffee of the Python Software Foundation. I was lucky enough to spend some time with him at lunch, and I’m a big PSF fan.
It would be hard to underestimate the impact of Python in modern computing, but despite its popularity the Python Foundation runs on only $5 million a year (compare that to the over $200 million spent by the Linux Foundation). Thus they have to get creative where they can, and Coffee talked about how they used Grafana to provide self-service dashboards so that projects can see the status of the Python infrastructure (specifically the PyPI package repository).
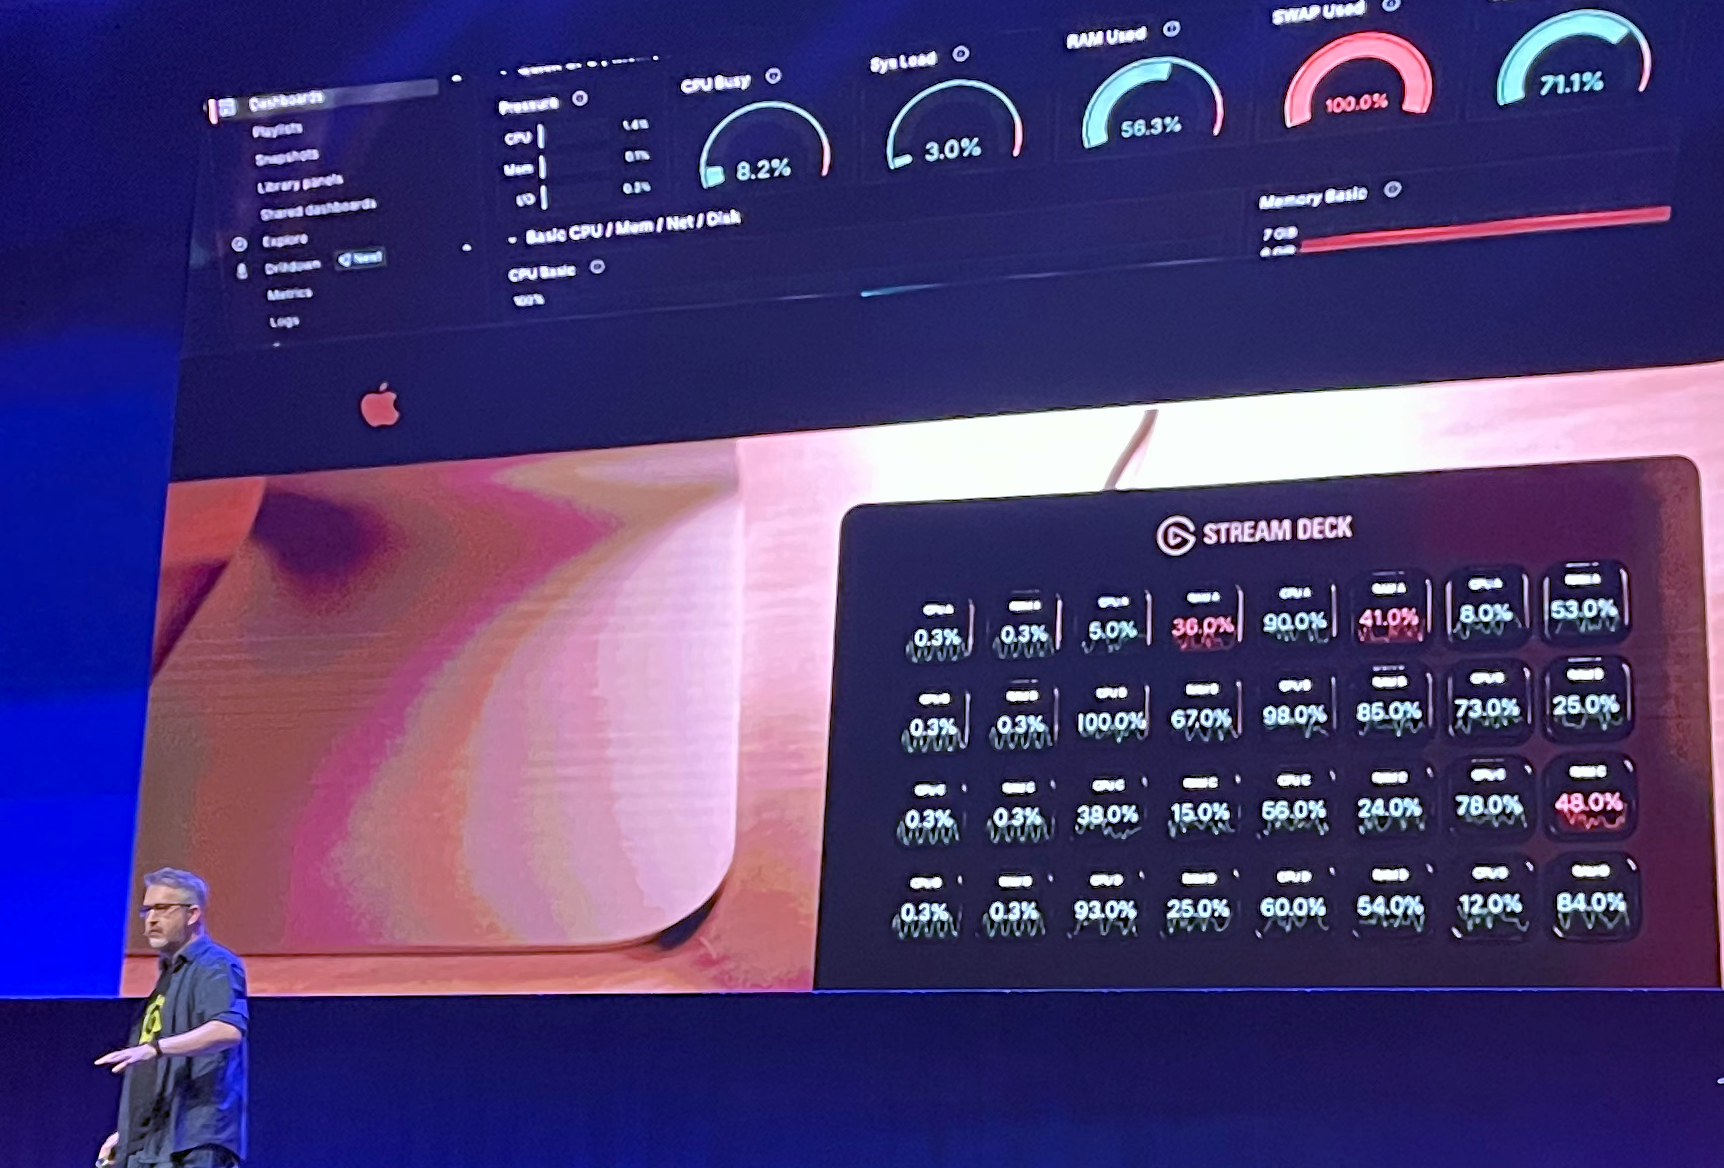
The next short talk was by Gerard de Jong who showed off a rather clever hack using an Elgato Stream Deck.
The Stream Deck was created to make it easier for video creators to switch between settings in their recording studios, but it can be repurposed for other uses. His talk started off with how humans perceive vision, and in order to leverage that he modified the Stream Deck to display various values via Grafana that would be optimally placed in the lower part of one’s peripheral vision. The icons are also buttons, so pressing the button will bring up the associated dashboard on the main computer screen.
This is one of the things I love most about Grafana - the amazing integrations it enables. In my previous life at OpenNMS we used to have an annual developers conference every year, but due to COVID we decided to host it virtually in 2020. We landed on Minecraft as the best platform. One of the best things about the conference were the conversations, and there was a plugin that would mimic real life in that if you were close to a person’s avatar you could hear them plainly but it faded as you moved away, just like in real life.
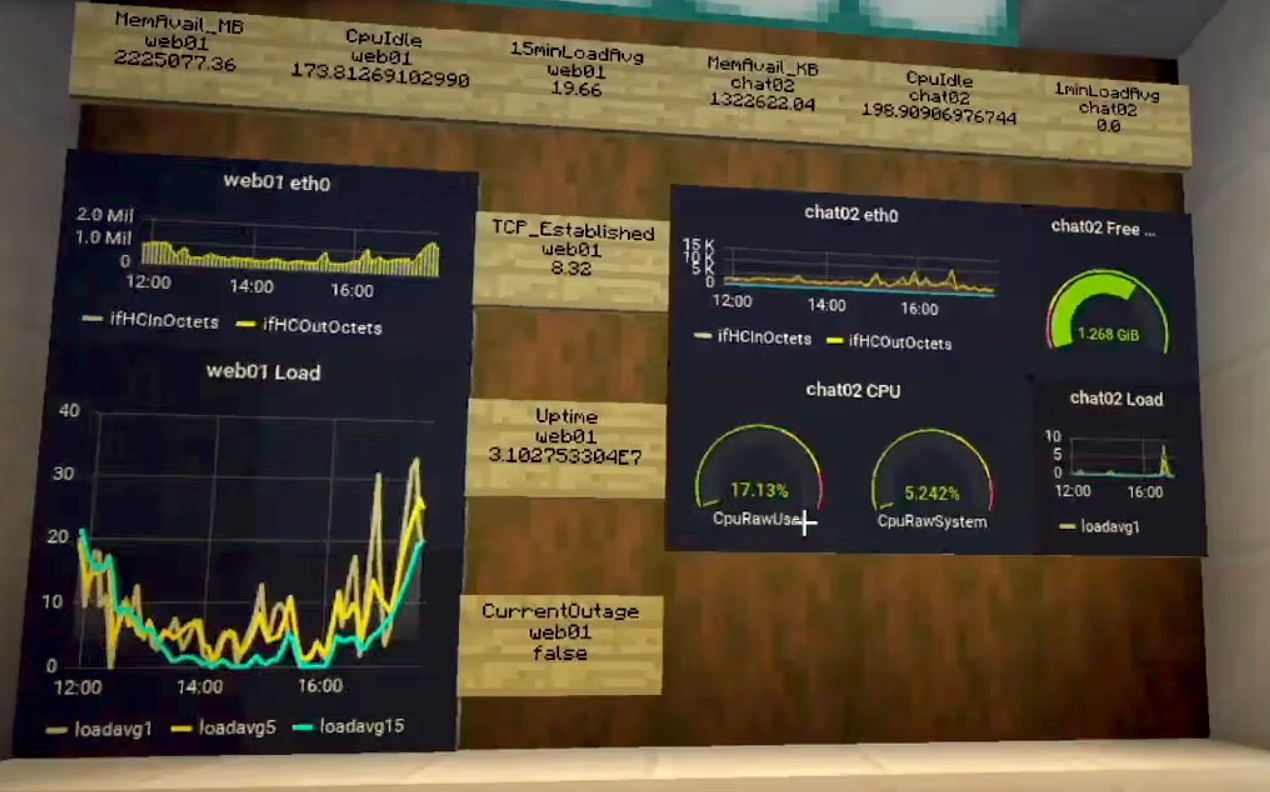
Zoë Knox decided to build a Network Operations Center (NOC) in the game (presented at GrafanaCon that year), and it featured Grafana dashboards. de Jong’s hack reminded me of it, as they both had to deal with limited resolution.
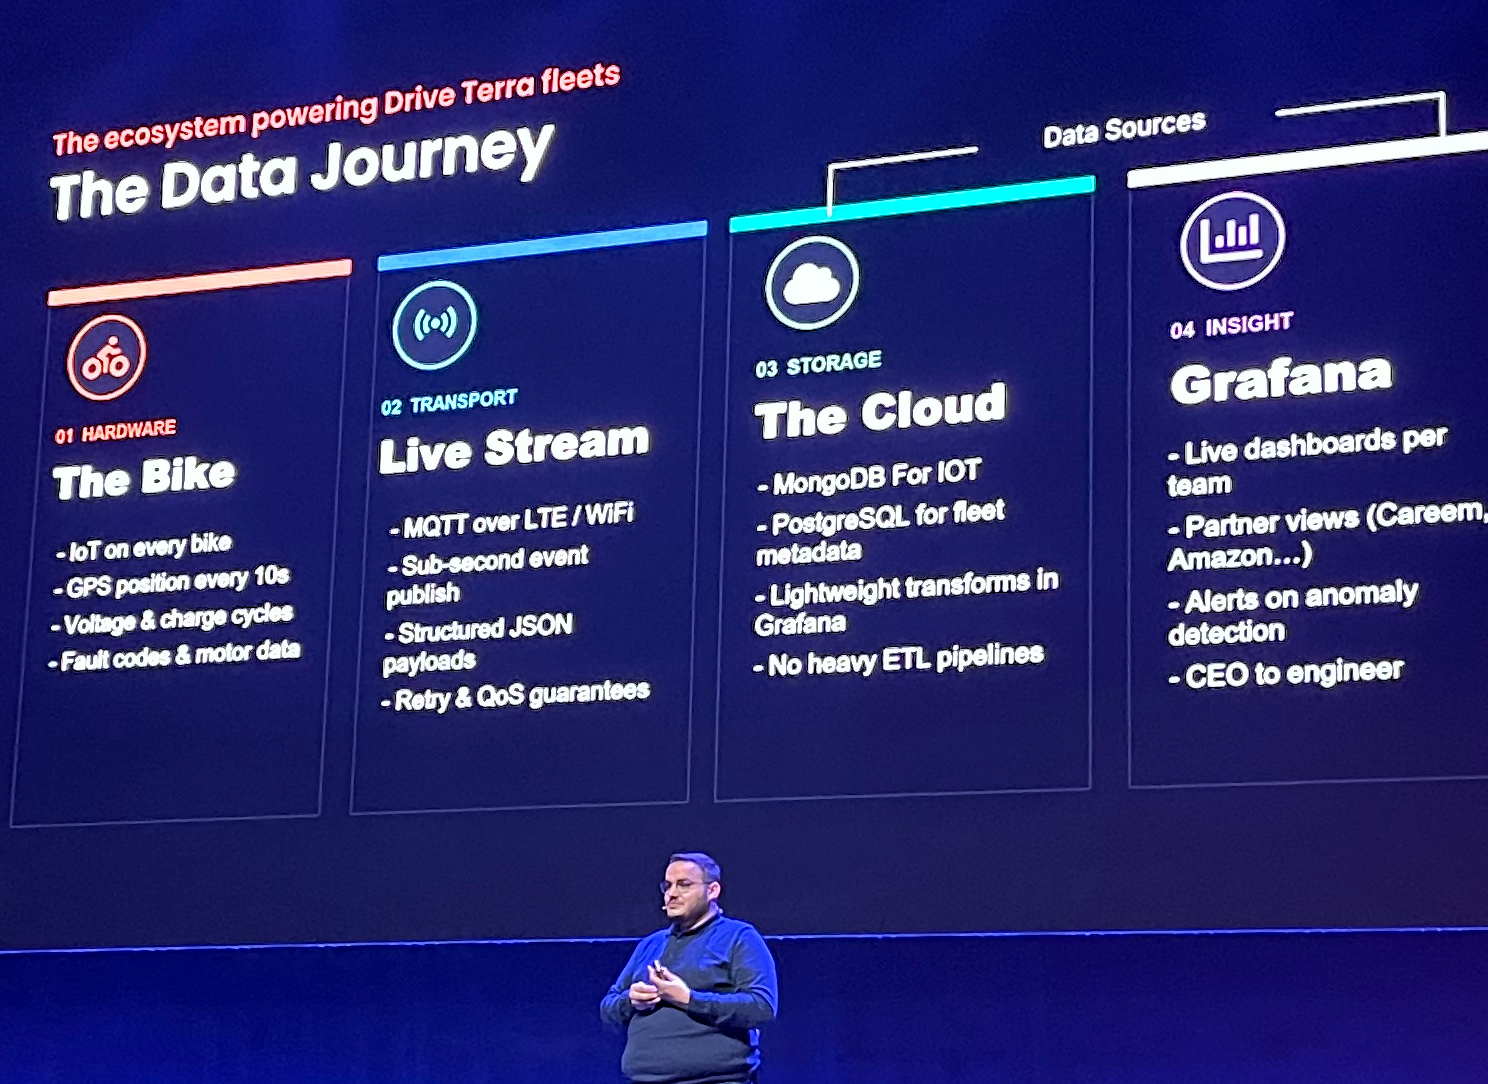
Mohammad Omar gave the next talk which was how Drive Terra, an e-bike company that focuses mainly on delivery companies (such as Amazon) in the Middle East and Africa, uses Grafana to monitor its fleet.
One of the things that is cool about the company is that their bike’s batteries can be swapped. While I don’t own an electric vehicle (yet) I can envision a time where car batteries are standardized, much in the same way that we have AA, AAA, D and other battery sizes. Instead of having to wait for your EV to charge, you just pull up and a robot removes your old battery and replaces it with a new one. This is similar to how propane cylinders are sold in the US - you pull up to the grocery store, return your empty cylinder and get a fresh one. At the moment, battery tech is a major differentiator in the market, so I don’t expect to see it soon, but it is the best way to address the need for rapid recharging.
I had met Omar in the Exhibit Hall and I was eager to hear his presentation. Like Iarnród Éireann, they use MQTT for collecting telemetry from the bikes, and then they can create dashboards to monitor the fleet, give visibility to their partners who use the bikes for delivery, and even create a “CEO View” for management.
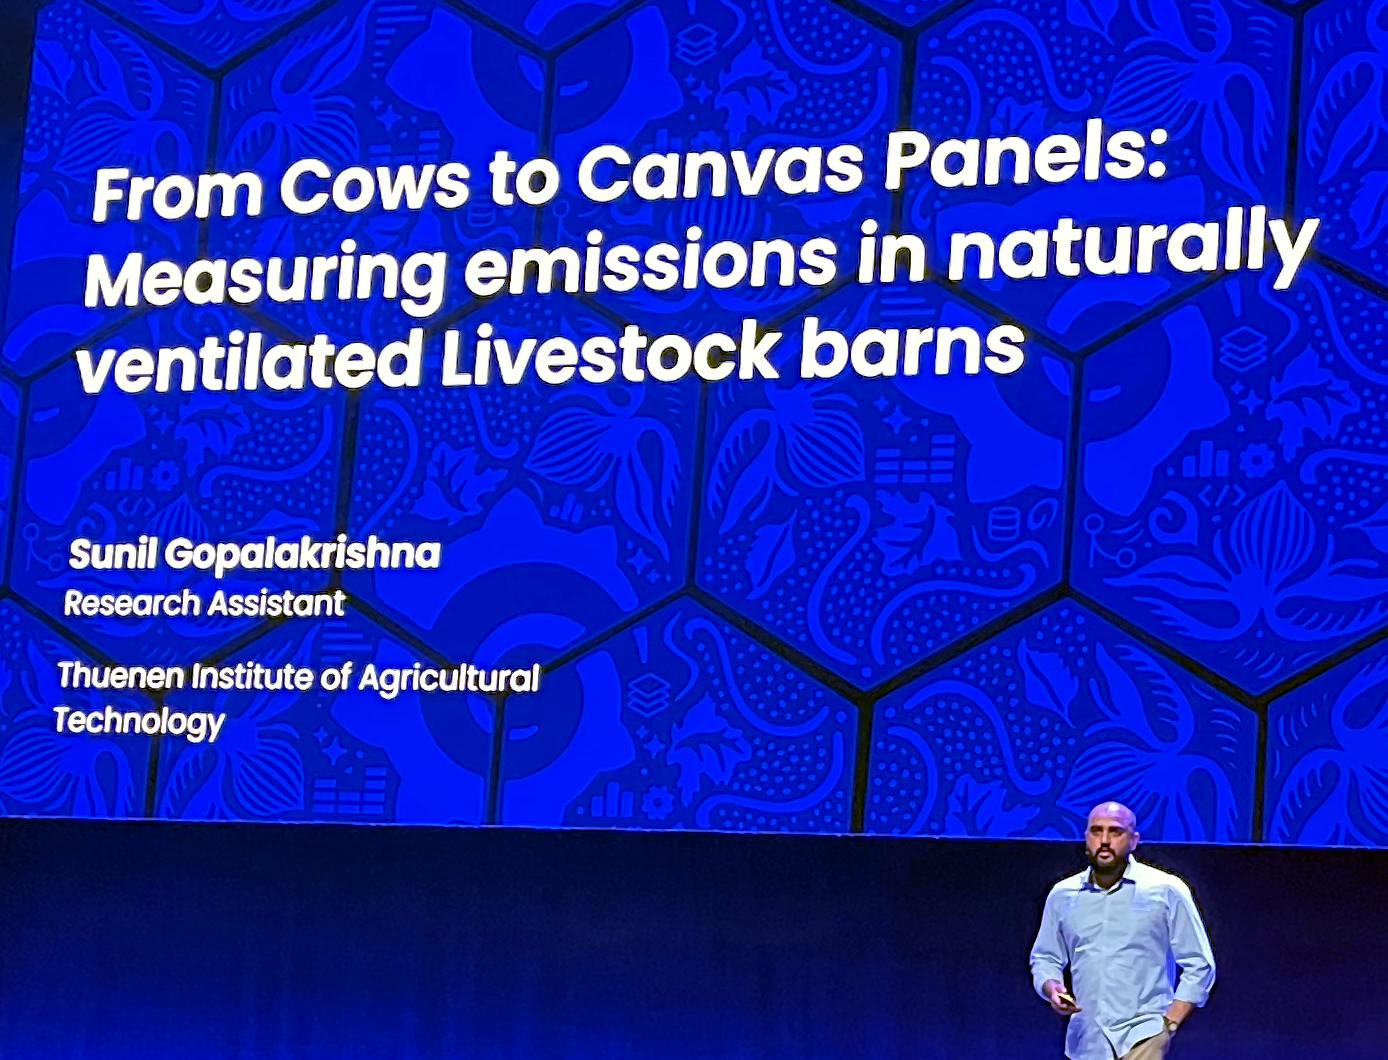
The final presentation was given by Sunil Gopalakrishna and was also focused on IoT-based data collection. Measuring air quality is important in commercial livestock barns, so he discussed a device (it was a sphere about the size of a softball) that collected such data and aggregated it via Grafana dashboards.
And that was it. After two amazing days the conference was over.
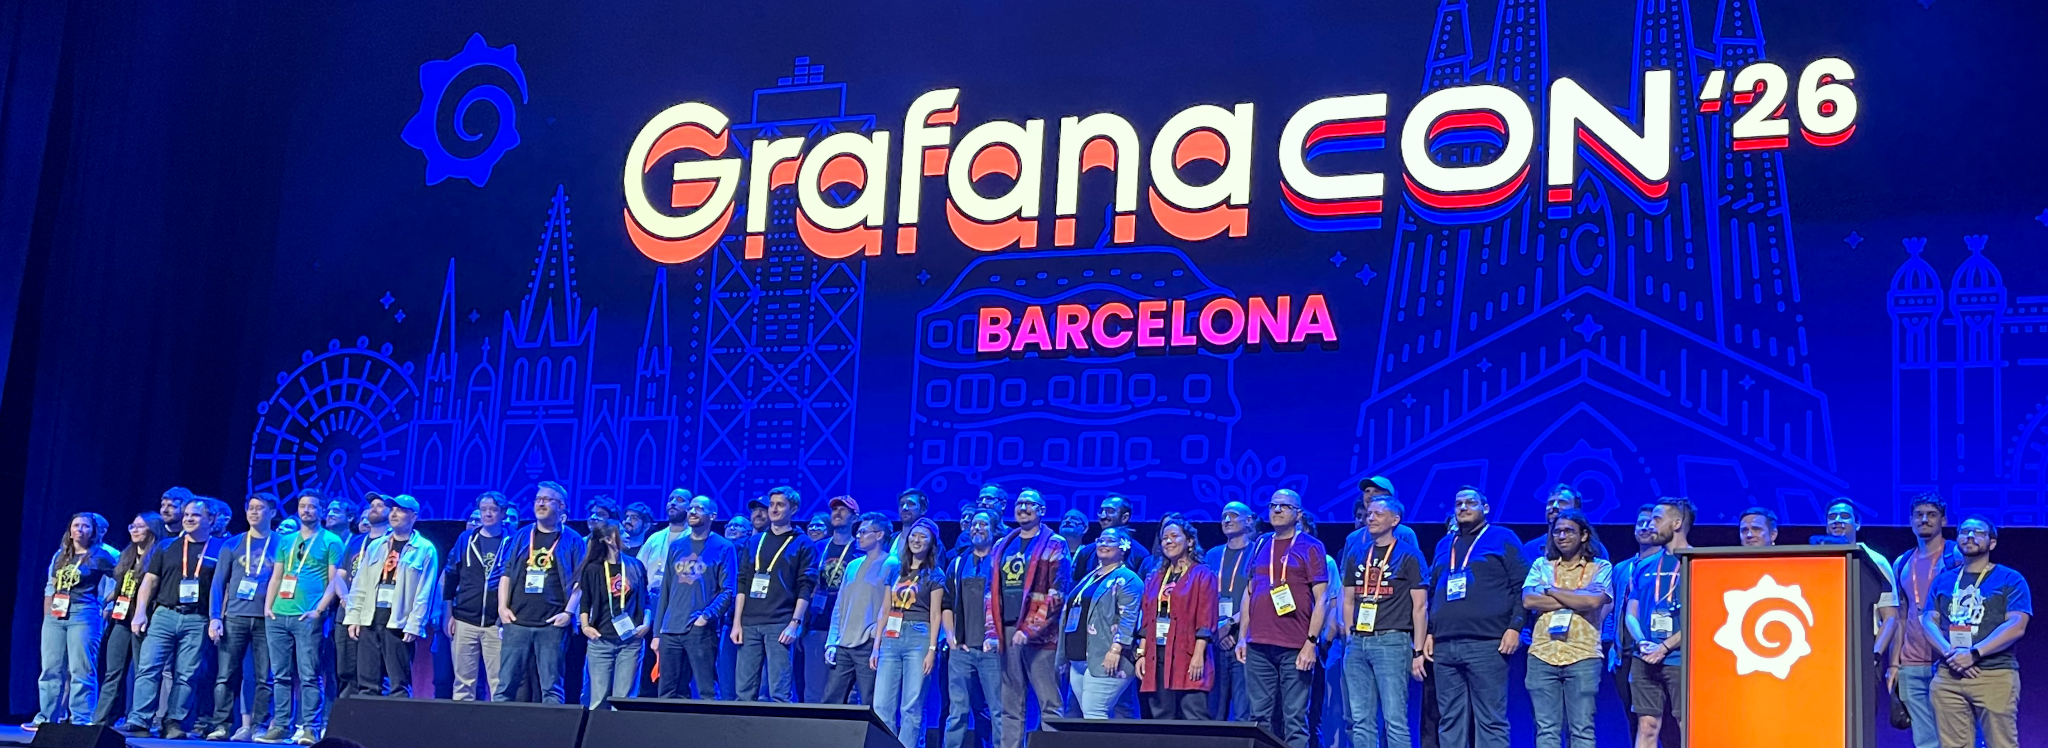
It takes a lot of people to make a conference like GrafanaCon, so they all got on stage for a picture.
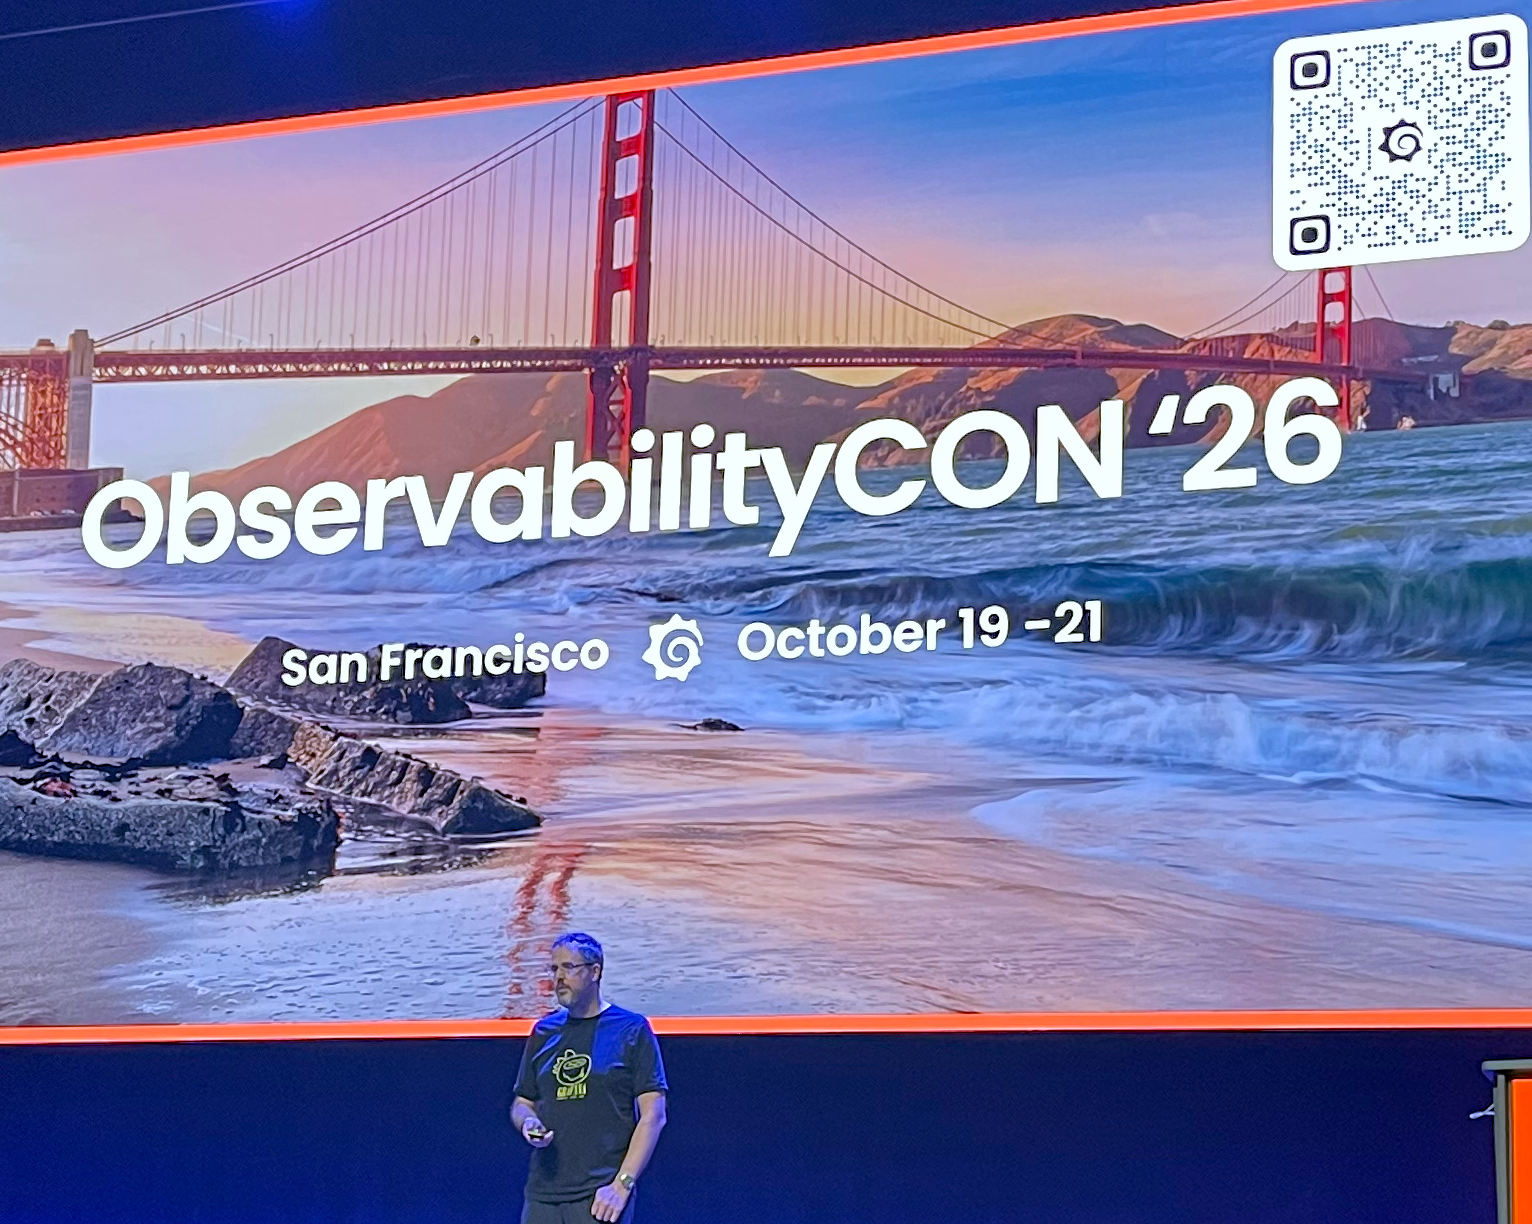
They also brought up the next Grafana event, ObservabilityCon to be held in San Francisco, 19-21 October.
I hope to attend and that AWS will be a sponsor.
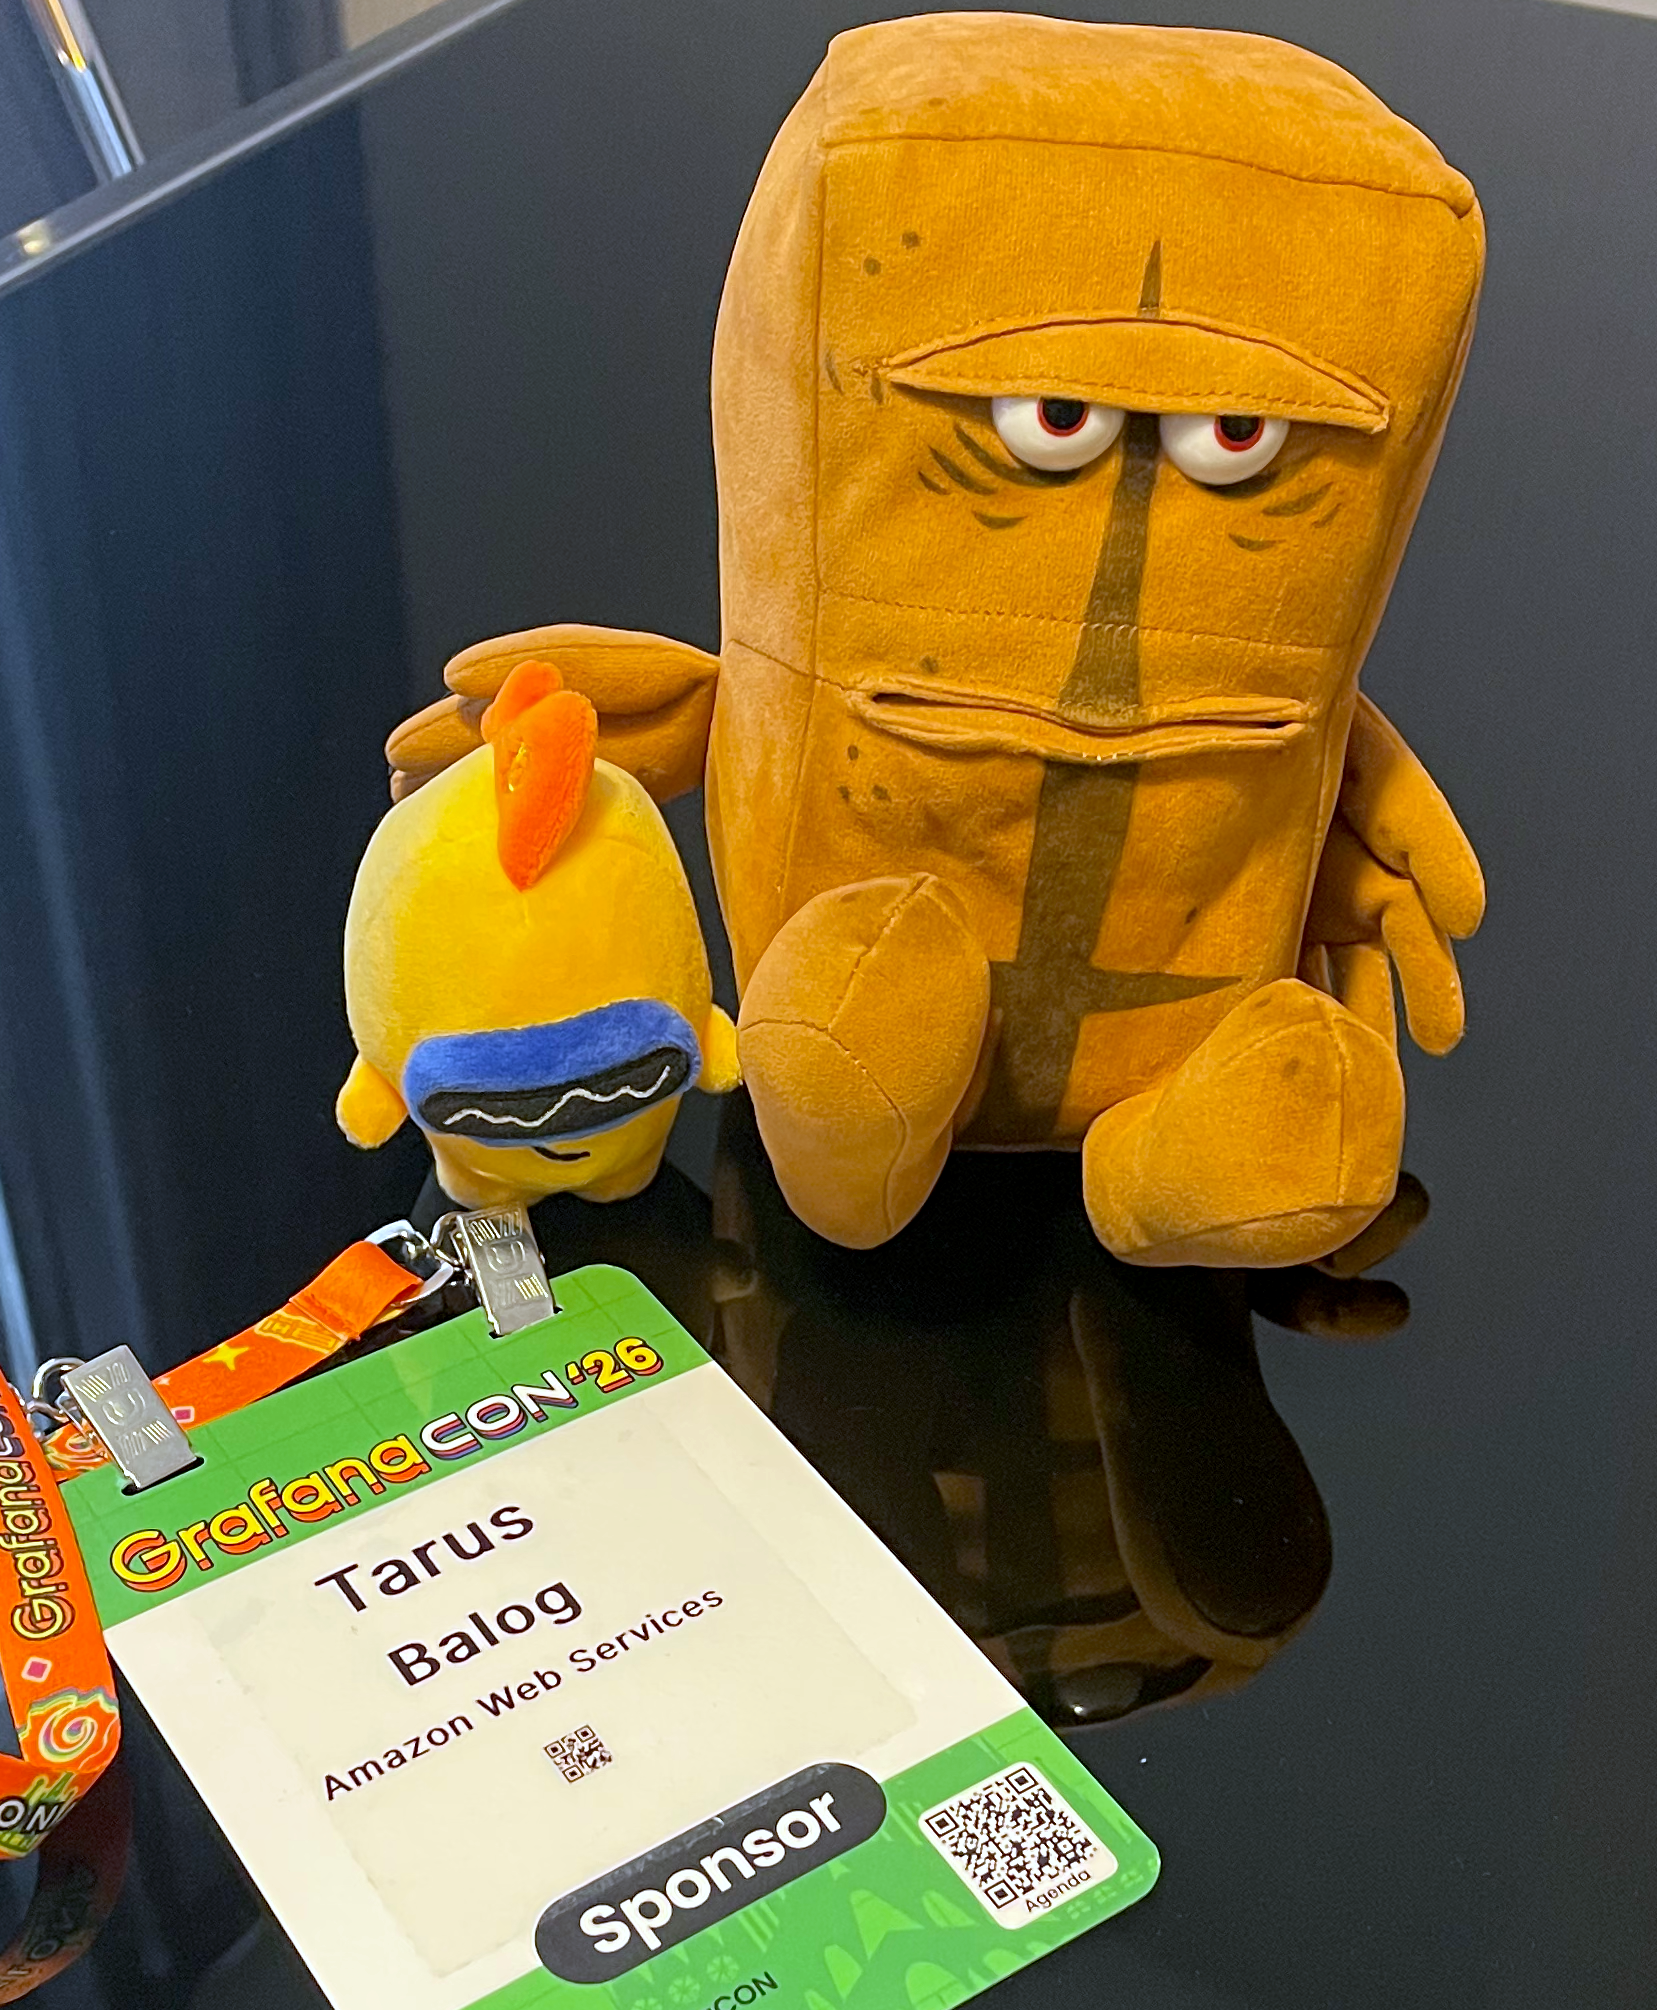
Finally, Bernd got a new friend.
I figure by now I’ve lost all but one of my three readers, and I apologize for the click-baity “I hated it” lede. It was a truly amazing event with only one or two nit-picky issue keeping it from being truly perfect.
The thing I love the most about open source is that getting involved in open source communities builds these great personal attachments with the technology you use, versus just being transactional. GrafanaCon reminded me of the fun and excitement I had working in observability, and I didn’t realize how much I’d missed it.
I am currently playing with Grafana Cloud using the free tier. It is so easy to sign up - no credit card needed - just a valid email address. I promise a writeup on my experience soon.
If you are into monitoring or are just observability-curious, check out Grafana (they have a Slack) and plan on attending GrafanaCon.
With luck I’ll see you there.